- Title
-
Fibulin 5, a human Wharton's jelly-derived mesenchymal stem cells-secreted paracrine factor, attenuates peripheral nervous system myelination defects through the Integrin-RAC1 signaling axis
- Authors
- Won, S.Y., Kwon, S., Jeong, H.S., Chung, K.W., Choi, B.O., Chang, J.W., Lee, J.E.
- Source
- Full text @ Stem Cells
|
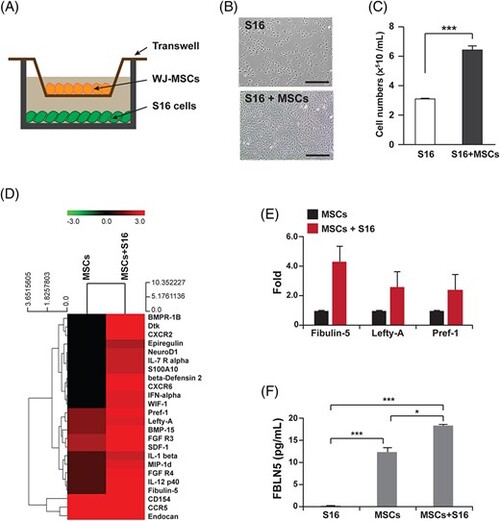
Identification of WJ-MSCs derived paracrine factors affecting Schwann cell proliferation. A, A schematic diagram for the co-cultivation system of MSCs and S16 cells. B, Images of S16 cells after 24 hours of cultivation with or without WJ-MSCs. Scale bars, 400 μm. C, Quantification of total number of S16 cells counted at each indicated condition. Statistical significance was determined using the unpaired Student's t-test with Welch's correction (***P < .001). D, A heatmap comparing the expression of secreted proteins in the media collected from the indicated culture conditions. E, Quantifications of fold changes in spot intensities for Fibulin 5, Lefty-A, and Pref-1. F, The concentration of FBLN5 contained in the culture media collected from each indicated condition was measured using ELISA. Statistical significance was determined using one-way ANOVA followed by Tukey's post hoc test (*P < .005, ***P < .001) |
|
FBLN5 promotes the proliferation of Schwann cells. A, Proliferating cells in the S16 cells treated with FBLN5 at the indicated concentrations were counted by CCK-8 assay at the indicated incubation times. Statistical significance was determined using 2-way ANOVA followed by Bonferroni's post hoc test (***P < .001, ns: non-significant). B, Images of S16 cells after 24 hours of cultivation with nothing, recombinant FBLN5, or with siRNAs-transfected WJ-MSCs. Scale bars, 400 μm. C, Quantification of total S16 cell numbers counted for each indicated condition. Statistical significance was determined using one-way ANOVA followed by Tukey's post hoc test (**P < 0.005, ns: non-significant). D, Images of S16 cells with or without recombinant FBLN5, comparing proliferating cells by BrdU assay. Cellular nuclei were stained with DAPI (blue). Scale bars, 400 μm. E, Quantification of proliferative cells in (D) from each field of view at the indicated time points. Statistical significance was determined using 2-way ANOVA followed by Bonferroni's post hoc test (**P < .005, ***P < .001, ns: non-significant). The data are shown as the mean ± SD of three independent experiments per condition |
|
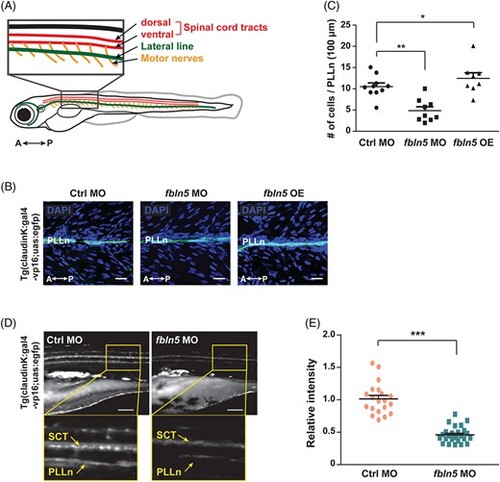
FBLN5 is required for myelination of Schwann cells. A, A diagram of zebrafish larvae identifying the simplified peripheral nervous system, consisting of the spinal cord tracts, lateral lines, and the spinal motor nerves. A, anterior; P, posterior. B, Lateral view images of the whole-mounted Tg(claudin K:gal4-vp16;uas:egfp) zebrafish injected with control-, fbln5-MOs, or fbln5 mRNA after DAPI staining at 4 dpf. PLLn (green), posterior lateral line; A, anterior; P, posterior. OE, overexpression. Scale bars, 20 μm. C, Quantification of cell numbers counted within the PLLn of (B) images. Statistical significance was determined using one-way ANOVA followed by Dunnett's post hoc test (*P < .05, **P < .005). D, Lateral view images of the Tg(claudin K:gal4-vp16;uas:egfp) zebrafish injected with control-MOs or fbln5-MOs at 5 dpf. The images within the rectangles are magnified in the bottom panels. SCT, spinal cord tracts; PLLn, posterior lateral line; A, anterior; P, posterior. Scale bars, 100 μm. E, Quantification of the relative intensity of PLLn in equivalent fields of view in the images of (D). Statistical significance was determined using the unpaired Student's t-test with Welch's correction (***P < .001). The data are shown as the mean ± SD of three independent experiments with ≥20 embryos per condition (C and E) |
|
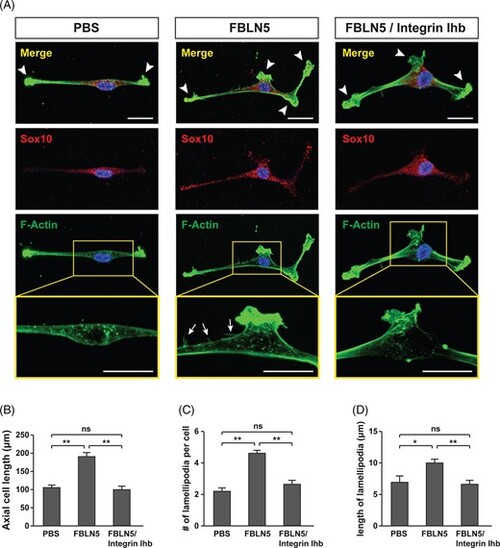
FBLN5 regulates Integrin-mediated actin dynamics in Schwann cells. A, Images of mouse primary Schwann cells double immunostained with Sox10 and F-actin antibodies after treatment with recombinant FBLN5 alone or with an integrin inhibitor (Integrin Ihb). PBS-treated Schwann cells were used as controls. Arrowheads and arrows indicate lamellipodia and filopodia, respectively. Scale bars, 20 μm. B-D, Quantification of axial cell length in (B), lamellipodia number/cell in (C), and lamellipodia length/cell in (D) from data examined using the ImageJ software within equivalent fields of view in the images of (A). The data are shown as the mean ± SD of three independent experiments. Statistical significance was determined using one-way ANOVA followed by Tukey's post hoc test (*P < .05, **P < .005; ns, nonsignificant) |
|
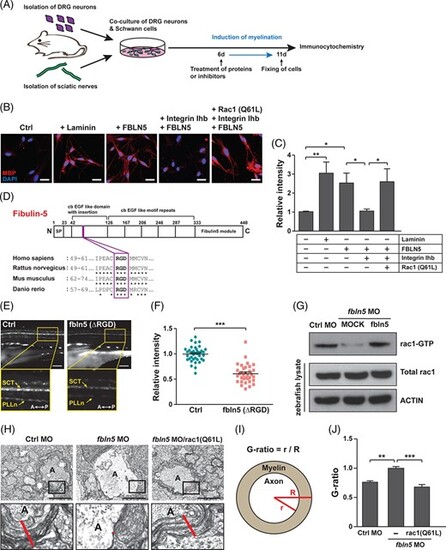
FBLN5 regulates myelination through RAC1 activation in Schwann cells. A, A schematic diagram of the induction of axonal myelination by the co-culturing of mouse primary DRG neurons and Schwann cells isolated from sciatic nerves. The cells were treated with proteins or inhibitors at 6 days after co-cultivation and fixed for immunostaining 5 days after the treatment. B, Images of mouse primary Schwann cells immunostained with anti-MBP antibodies after co-cultivation with primary DRG neurons under the indicated conditions. Laminin-treated Schwann cells were a positive control of myelination-induced cells. Scale bars, 20 μm. C, Quantification of the relative intensities of MBP staining in the images of (B). Statistical significance was determined using one-way ANOVA followed by Tukey's post hoc test (*P < .05, **P < .005). D, A schematic diagram of the human FBLN5 protein structure identifying the RGD motif conserved in rat, mouse, and zebrafish fbln5 protein. E, Lateral view images of the Tg(claudin K:gal4-vp16;uas:egfp) zebrafish injected with MOCK or fbln5 (ΔRGD) mRNAs at 5 dpf. The images within the rectangles are magnified in the bottom panels. SCT, spinal cord tracts; PLLn, posterior lateral line; A, anterior; P, posterior. Scale bars, 100 μm. F, Quantification of the relative intensity of PLLn in equivalent fields of view in the images of (E). The data are shown as the mean ± SD of three independent experiments with ≥20 embryos per condition. Statistical significance was determined using unpaired Student's t-test with Welch's correction (***P < .001). G, Results of pull-down assay for active rac1 in the indicated zebrafish tissues using PAK-PBP beads. Protein levels were normalized against β-actin in the same blots. H, TEM images of cross-sectioned zebrafish of the indicated genotype at 5 dpf. The images within the rectangles are magnified in the bottom panels. The red lines indicate the thicknesses of the myelin sheaths in the Mauthner axons. A, axon. Scale bars, 2 μm. I, A schematic diagram of how the G-ratio is obtained: the G-ratio is calculated by dividing the radius of the axon (r) by the total radius of the axon and myelin (R). J, Quantification of G-ratios calculated in the Mauthner axons of the indicated zebrafish. Statistical significance was determined using one-way ANOVA followed by Dunnett's post hoc test (**P < .005, ***P < .001). The data are shown as the mean ± SD (C, F, J) PHENOTYPE:
|
|
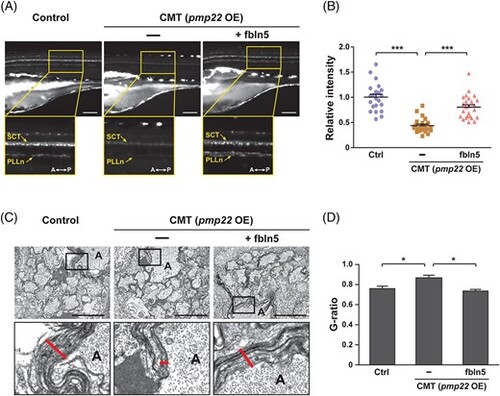
FBLN5 restores the myelination defects in the CMT zebrafish model. A, Lateral view images of the Tg(claudin K:gal4-vp16;uas:egfp) control and zebrafish injected with pmp22 mRNAs alone or with fbln5 mRNAs at 5 dpf. The images within the rectangles are magnified in the bottom panels. SCT, spinal cord tracts; PLLn, posterior lateral line; A, anterior; P, posterior; OE, overexpression. Scale bars, 100 μm. B, Quantification of the relative intensities of PLLn in equivalent fields of view in the images of (A). Statistical significance was determined using the one-way ANOVA followed by Dunnett's post hoc test (***P < .001). C, TEM images of cross-sectioned zebrafish of the indicated genotype at 5 dpf. The images within the rectangles are magnified in the bottom panels. The red lines indicate the thicknesses of the myelin sheaths in the Mauthner axons. A, axon. Scale bars, 2 μm. D, Quantification of the G-ratios calculated in mauthner axons of the indicated zebrafish. Statistical significance was determined using the one-way ANOVA followed by Dunnett's post hoc test (*P < .05). The data are shown as the mean ± SD (B, D) |
|
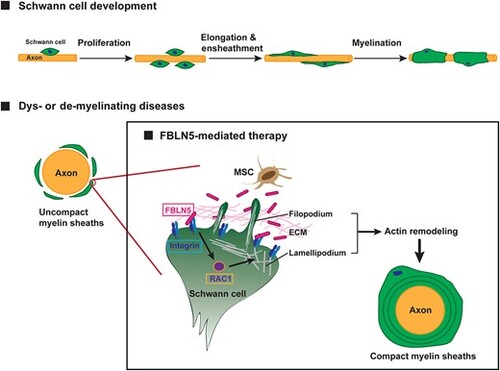
Overall proposed model of the therapeutic mechanism of FBLN5 in myelin-related diseases. Proper development of Schwann cells through the processes of proliferation, elongation, and myelination is essential for the functioning of the PNS. The common pathological symptom of dysmyelinating and demyelinating diseases is uncompact myelin ensheathments of the axons. Our findings suggest that FBLN5 secreted from MSCs or recombinant FBLN5 present in the ECM binds to the Integrin receptors and promotes actin remodeling through RAC1 activation in the Schwann cells. Then, the Schwann cells are recovered by an activated actin remodeling mechanism and induce the compact myelination of the diseased axons |

