
Fig. 6
- ID
- ZDB-IMAGE-240703-23
- Publication
- Won et al., 2020 - Fibulin 5, a human Wharton's jelly-derived mesenchymal stem cells-secreted paracrine factor, attenuates peripheral nervous system myelination defects through the Integrin-RAC1 signaling axis
- All Figures
- Figures for Won et al., 2020
|
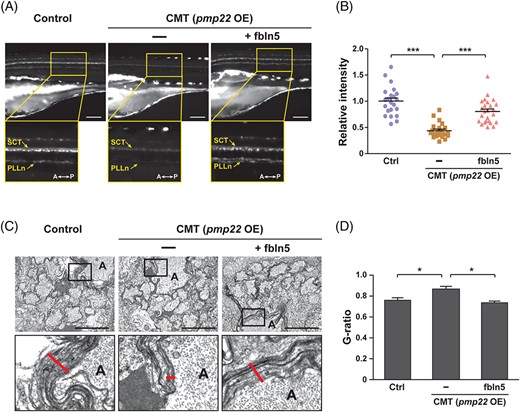
Fig. 6 FBLN5 restores the myelination defects in the CMT zebrafish model. A, Lateral view images of the Tg(claudin K:gal4-vp16;uas:egfp) control and zebrafish injected with pmp22 mRNAs alone or with fbln5 mRNAs at 5 dpf. The images within the rectangles are magnified in the bottom panels. SCT, spinal cord tracts; PLLn, posterior lateral line; A, anterior; P, posterior; OE, overexpression. Scale bars, 100 μm. B, Quantification of the relative intensities of PLLn in equivalent fields of view in the images of (A). Statistical significance was determined using the one-way ANOVA followed by Dunnett's post hoc test (***P < .001). C, TEM images of cross-sectioned zebrafish of the indicated genotype at 5 dpf. The images within the rectangles are magnified in the bottom panels. The red lines indicate the thicknesses of the myelin sheaths in the Mauthner axons. A, axon. Scale bars, 2 μm. D, Quantification of the G-ratios calculated in mauthner axons of the indicated zebrafish. Statistical significance was determined using the one-way ANOVA followed by Dunnett's post hoc test (*P < .05). The data are shown as the mean ± SD (B, D)