
- Title
-
Photocaged Hoechst enables subnuclear visualization and cell selective staining of DNA in vivo
- Authors
- Lämmle, C.A., Varady, A., Müller, T.G., Sturtzel, C., Riepl, M., Mathes, B., Eichhorst, J., Sporbert, A., Lehmann, M., Kräusslich, H.G., Distel, M., Broichhagen, J.
- Source
- Full text @ Chembiochem
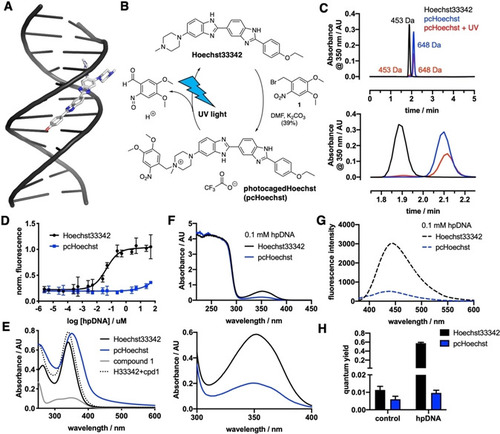
Synthesis and |
|
|
|

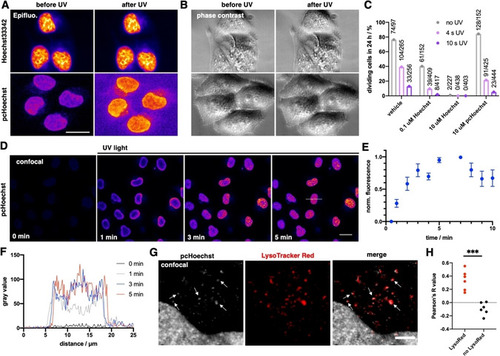
pcHoechst uncaging allows cell targeting and subnuclear visualization of DNA. A) Confocal imaging of live HeLa cells incubated with pcHoechst (100 nM) using a FRAP bleach point with UV light in the indicated area (white circle) shows nuclear staining. High laser power (110–1100 μW for 10–15 s) activates the entire cell. Scale bar: 10 μm. B) As for (A) but with lower laser power (1.42 μW for 10–15 s) allows more precise uncaging in a fraction of the nucleus C) with a resolution of 1.4–1.7 μm that D) remained stable over 90 s. Representative images from three repetitions. E) Confocal images of live HeLa cells incubated with pcHoechst (10 μM) targeting a bleach point with a two‐photon laser (720 nm, 19.7 mW) in the indicated area (white circle) shows subnuclear staining in the illuminated periphery. Representative images of |