
- Title
-
Mixture effects of oxygenated PAHs and benzo[a]pyrene on cardiovascular development and function in zebrafish embryos
- Authors
- Cunha, V., Vogs, C., Le Bihanic, F., Dreij, K.
- Source
- Full text @ Environ. Int.
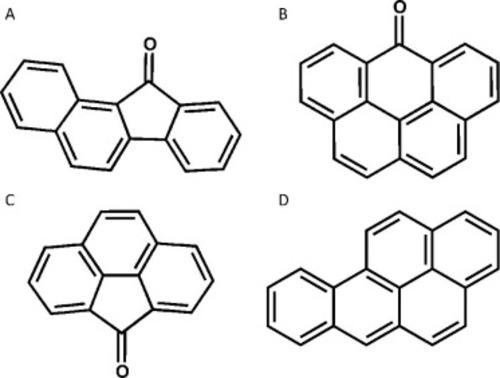
Fig. 1. Chemical structures of PACs used in the study; benzo[a]fluorenone (A, BFLO), 6H-benzo[cd]pyren-6-one (B, 6H-BPO), 4H-cyclopenta[def]phenanthrene-4-one (C, 4H-CPO), and benzo[a]pyrene (D, BaP). |

Fig. 2. Relative gene expression of cyp1a (A) and ahr2 (B), and EROD activity (C) in ZFEs exposed to oxy-PAHs alone (0.1–1.0 µM) or in combination with BaP (1 µM) between 24 and 96 hpf. Data are presented as means ± SE (n = 2 – 5). Analysis of statistical differences between each exposure compared to the DMSO control was performed using one-way ANOVA (*P < 0.05, **P < 0.01, and ***P < 0.001). Student’s t-test was used for statistical analysis to evaluate whether more or less than additive effects in co-exposures was shown compared to sum of single exposures (XP < 0.05, XXP < 0.01, and XXXP < 0.001). |

Fig. 3. Relative gene expression of genes related with cardiovascular development and function (panels A – E; atp2a2, zerg, myh6, tbx5, and tnnt2) in ZFEs exposed to oxy-PAHs alone (0.1–1.0 µM) or in combination with BaP (1 µM) between 24 and 96 hpf. Data are presented as means ± SE (n = 2–5). Analysis of statistical differences between each exposure compared to the DMSO control was performed using one-way ANOVA (*P < 0.05, **P < 0.01, and ***P < 0.001). Student’s t-test was used for statistical analysis to evaluate whether more or less than additive effects was observed in co-exposures compared to sum of single exposures (XP < 0.05, XXXXX
|
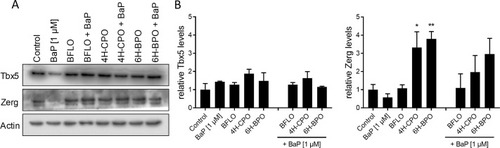
Fig. 4. Protein expression levels of Tbx5 and Zerg (A) in ZFEs exposed to oxy-PAHs alone (0.3 µM) or in combination with BaP (1 µM) between 24 and 96 hpf. Densitometry analysis of normalized expression levels is shown in B. Actin was used as a loading control and DMSO was used as solvent control in all experiments. Data are presented as means ± SE (n = 2–5) with *P < 0.05 as compared to control by one-way ANOVA. |
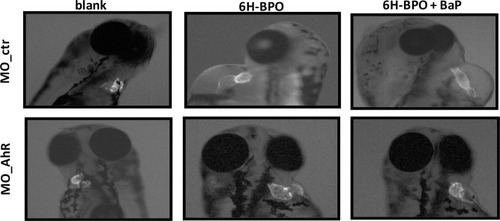
Fig. 5. ZFEs injected with control morpholino (MO_ctr) (top row panels) or with AhR morpholino (MO_AhR) (bottom row panels) exposed to 6H-BPO alone (0.3 µM) or in combination with BaP (1 µM) between 24 and 96 hpf. The heart is shown in green given by transgenic zebrafish [Tg (cmlc2:EGFP)]. (For interpretation of the references to colour in this figure legend, the reader is referred to the web version of this article.) |

Fig. 6. Time courses of concentrations for 6H-BPO and BaP alone or in combination in ZFE-free medium (A and B), in ZFE-medium (C and D) and in ZFE (E and F). The concentration measurements of the binary mixture were only conducted until 96 hpf due to high lethality at 120 hpf. The lines represent simulated internal concentrations using a one-compartment model. All values are stated as mean ± SE, n = 3–5. See also Table S2. |
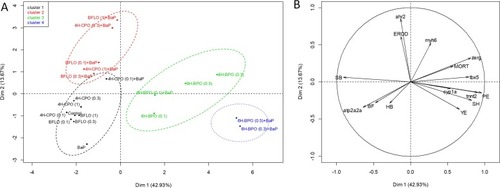
Fig. 7. Principal component analysis of data from ZFE exposed to the three oxy-PAHs, BaP and their mixtures. Panel A shows the individual factor map with four clusters indicated by ellipses and B shows the variables factor map. EROD, MORT, PE, SH, YE, HB, BF and SB stands for EROD activity, mortality, pericardial edema, string heart, yolk-sac edema, heartbeat rate, blood flow, and swim-bladder inflation, respectively. See also Table S3. |