
IMAGE
Fig. 4
- ID
- ZDB-IMAGE-210129-30
- Publication
- Cunha et al., 2020 - Mixture effects of oxygenated PAHs and benzo[a]pyrene on cardiovascular development and function in zebrafish embryos
- All Figures
- Figures for Cunha et al., 2020
Image
|
Figure Caption
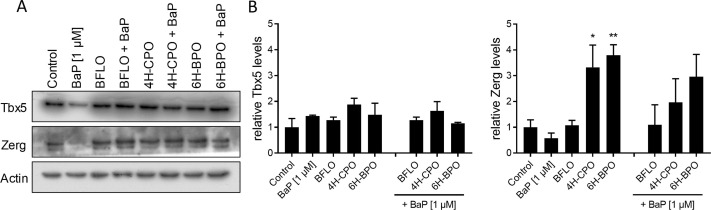
Fig. 4 Fig. 4. Protein expression levels of Tbx5 and Zerg (A) in ZFEs exposed to oxy-PAHs alone (0.3 µM) or in combination with BaP (1 µM) between 24 and 96 hpf. Densitometry analysis of normalized expression levels is shown in B. Actin was used as a loading control and DMSO was used as solvent control in all experiments. Data are presented as means ± SE (n = 2–5) with *P < 0.05 as compared to control by one-way ANOVA.
Acknowledgments
This image is the copyrighted work of the attributed author or publisher, and
ZFIN has permission only to display this image to its users.
Additional permissions should be obtained from the applicable author or publisher of the image.
Full text @ Environ. Int.