
Fig. 3
- ID
- ZDB-IMAGE-210129-29
- Publication
- Cunha et al., 2020 - Mixture effects of oxygenated PAHs and benzo[a]pyrene on cardiovascular development and function in zebrafish embryos
- All Figures
- Figures for Cunha et al., 2020
|
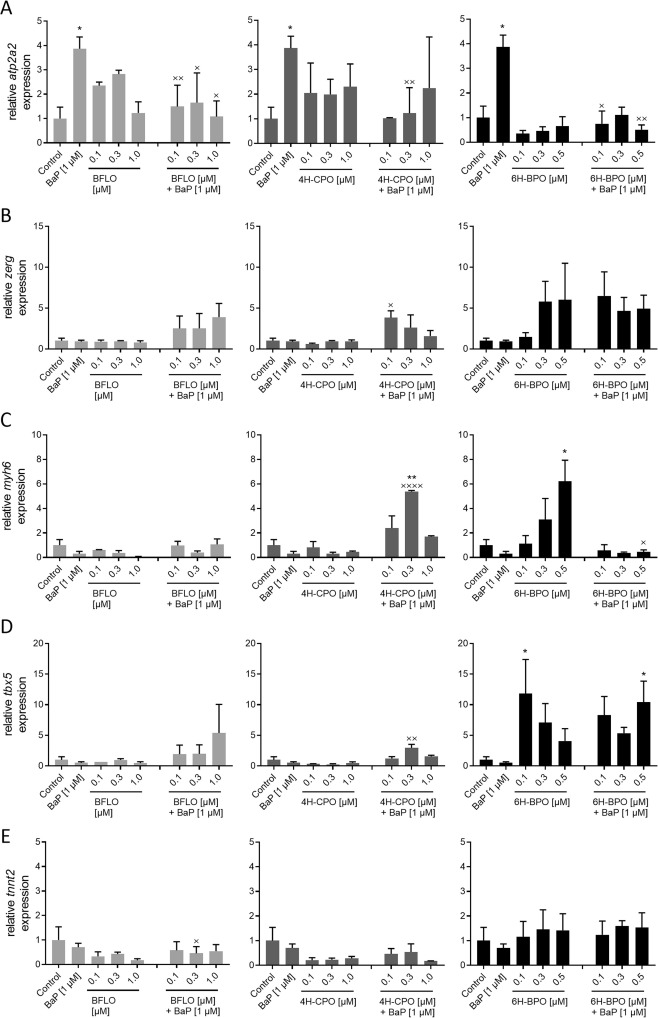
Fig. 3 Fig. 3. Relative gene expression of genes related with cardiovascular development and function (panels A – E; atp2a2, zerg, myh6, tbx5, and tnnt2) in ZFEs exposed to oxy-PAHs alone (0.1–1.0 µM) or in combination with BaP (1 µM) between 24 and 96 hpf. Data are presented as means ± SE (n = 2–5). Analysis of statistical differences between each exposure compared to the DMSO control was performed using one-way ANOVA (*P < 0.05, **P < 0.01, and ***P < 0.001). Student’s t-test was used for statistical analysis to evaluate whether more or less than additive effects was observed in co-exposures compared to sum of single exposures (XP < 0.05, XXXXX