- Title
-
Structure of TBC1D23 N-terminus reveals a novel role for rhodanese domain
- Authors
- Liu, D., Yang, F., Liu, Z., Wang, J., Huang, W., Meng, W., Billadeau, D.D., Sun, Q., Mo, X., Jia, D.
- Source
- Full text @ PLoS Biol.
|
(A) Ribbon diagrams of D23N, shown in two orientations rotated 180° with respect to each other. Cyan: TBC domain; gold: linker; yellow: rhodanese domain. (B) Electrostatic surface potential map of D23N, shown in two orientations rotated 180° with respect to each other. Blue: positive; red: negative; white: neutral. The molecules are in the same orientations as those above them in (A). D23N, N-terminus of TBC1D23; TBC, Tre2-Bub2-Cdc16. |
|
(A) Structural comparison of the crystal structures of TBC1D23 rhodanese domain (yellow) and of CDC25B (gray) (PDB ID: 1qbo). (B) Comparison of the activity site of CDC25B and the corresponding region of TBC1D23. Two essential residues (C473 and R479) from the catalytic CX5R motif of CDC25B are shown and labeled with black font. The corresponding residues (C399 and R405) in TBC1D23 are labeled in gold font. The SO42+ found in the catalytic site of CDC25B is colored in magenta. (C) The phosphatase activity of CDC25B WT, C473S, and TBC1D23 (aa1–460). pNPP was utilized as substrates. The reaction was carried out at 25 °C, and absorbance at 405 nm was monitored. Data are from three replicate experiments (mean ± S.D.), and the numerical data are included in |
|
(A) HeLa cells were transfected with mCherry or mCherry-TBC1D23 FL (“FL”), ΔRhod2 (deleting aa331–460), or C399S/R405A (399/405) and then fixed and labeled with anti-ZFPL1 (Golgi marker, green) antibody. Scale bar: 10 μm. (B) Quantitation of mCherry colocalization with ZFPL1 in cells as treated in (A). Each dot represents Pearson’s correlation coefficients from one cell. |
|
(A) Surface representation of one D23N monomer (molecule 1), with a fragment from symmetry-related D23N molecule shown as sticks (molecule 2, green). Molecule 1 is shown in the identical orientation to that in |
|
(A) GST pull-down analyses of HEK 293T cells transfected with vectors expressing GST, GST-TBC1D23-FL (“FL”), GST-TBC1D23-ΔTBC (deleting aa1–330), or GST-TBC1D23-ΔRhod1 (deleting aa331–513). Cell lysates were precipitated with glutathione-Sepharose beads and probed with anti-GST, golgin-97, or GAPDH (control) antibodies. (B) GST pull-down analyses of HEK 293T cells transfected with vectors expressing GST, GST-TBC1D23-FL (“FL”), TBC1D23-L278A/Y281A/Y282A (“278/281/282”), TBC1D23-I236A/I237A/V239A (“236/237/239”), or TBC1D23-E425K/Y426A (“425/426”). Cell lysates were precipitated with glutathione-Sepharose beads and probed with anti-GST, golgin-97, or GAPDH (control) antibodies. (C) HeLa cells were transfected with mCherry, or mCherry-TBC1D23 FL (“FL”), TBC1D23-L278A/Y281A/Y282A (“278/281/282”), TBC1D23-I236A/I237A/V239A (“236/237/239”), or TBC1D23-E425K/Y426A (“425/426”) and then fixed and labeled with anti-ZFPL1 (blue) antibody. Scale bar: 10 μm. (D) Quantitation of mCherry colocalization with ZFPL1 (Golgi marker) in cells as treated in (C). Each dot represents Pearson’s correlation coefficients from one cell. |
|
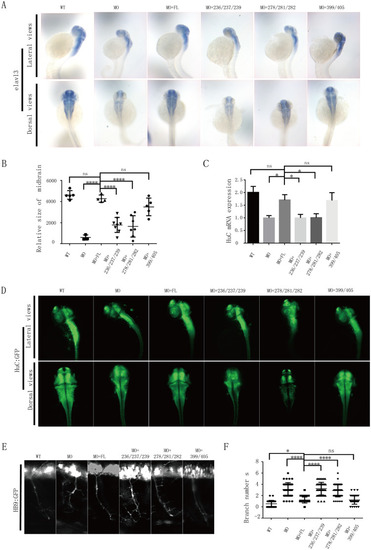
(A) HuC (elavl3) spatial expression in zebrafish at 48 hpf, determined by in situ hybridization. MO: MO injection; MO+ FL: MO and human FL TBC1D23 mRNA co-injection; MO+278/281/282: MO and human TBC1D23 L278A/Y281A/Y282A mutant mRNA co-injection; MO+236/237/239: MO and human TBC1D23 I236A/I237A/V239A mutant mRNA co-injection; MO+399/405: MO and human TBC1D23 C399S/R405A mutant mRNA co-injection. All injections are performed at the one-cell stage Top, lateral view; bottom, dorsal view. (B) The relative size of zebrafish midbrain. The size of the midbrain was measured from lateral view, and 5 to 10 embryos from each group were used for comparison. Data are presented as mean ± S.E.M. **** |


