FIGURE SUMMARY
Title

Chronic Exposure to Low Concentration Lead Chloride-Induced Anxiety and Loss of Aggression and Memory in Zebrafish

Authors
Bui Thi, N.H., Nguyen Thi, N.A., Audira, G., Siregar, P., Liang, S.T., Huang, J.C., Hsiao, C.D.
Source
Full text @ Int. J. Mol. Sci.

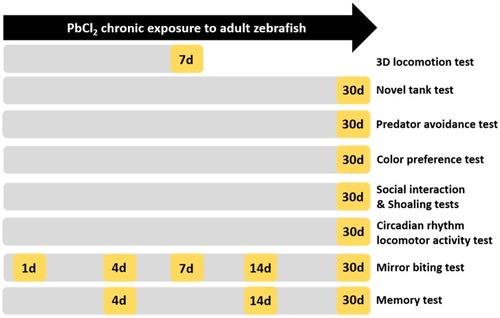
Schematic diagram of the evaluation of the neurobehavioral toxicity of PbCl2 in zebrafish. Yellow indicates the time points (day) for conducting behavioral assays. After 30 days, all fish were sacrificed and the biochemical assays were performed.

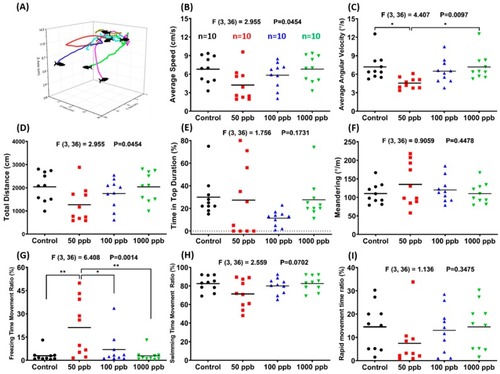
Comparison of three-dimensional (3D) behavior among seven-day PbCl2-exposed groups and a control group. (A) A schematic diagram showing the typical 3D locomotor paths of several individual fish, using our previously established method. Eight parameters were measured among treatments and a control group: (B) average speed, (C) average angular velocity, (D) total distance, (E) time in top duration, (F) meandering, (G) freezing time movement ratio, (H) swimming time movement ratio, and (I) rapid movement time ratio. Data are expressed in mean values evaluated by one-way ANOVA (n = 10; * p ≤ 0.05, and ** p ≤ 0.01).

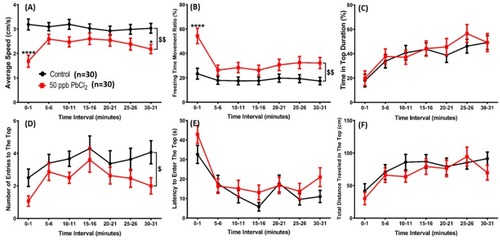
Comparison of behavioral endpoints in the novel tank exploration test among 30-day 50 ppb PbCl2-exposed groups and a control group. Six parameters were evaluated: (A) average speed, (B) freezing time movement ratio, (C) time in top duration, (D) number of entries to the top, (E) latency to enter the top, and (F) total distance traveled in the top. Data are expressed as mean ± SEM and analyzed by two-way ANOVA with Sidak’s multiple comparisons test (n = 30; */$ p ≤ 0.05, $$ p ≤ 0.01, and **** p ≤ 0.0001).

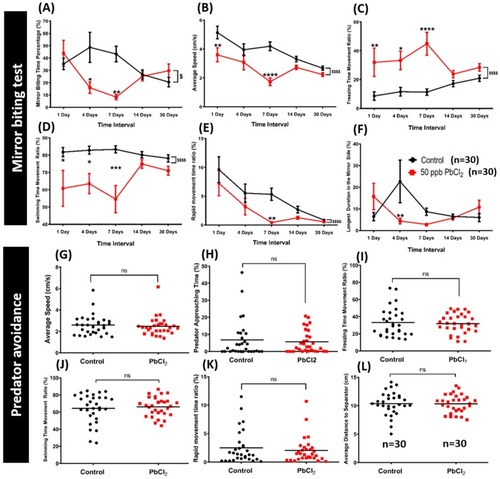
Evaluation of aggressiveness and fear by mirror-biting and predator avoidance tests between the control and 50 ppb PbCl2-treated fish. After PbCl2 exposure (red line), the mirror biting behavior was chronologically monitored and the data were presented as (A) mirror biting time percentage, (B) average speed, (C) freezing time movement ratio, (D) swimming time movement ratio, (E) rapid movement time ratio, and (F) longest duration in the mirror side. Data are expressed as mean ±SEM values and analyzed by two-way ANOVA with Sidak’s multiple comparisons test (n 1 & 7 days = 10, n 14 days = 40, n 30 days = 30; */$ p ≤ 0.05, ** p ≤ 0.01, *** p ≤ 0.001 and ****/$$$$ p ≤ 0.0001). After PbCl2 exposure for 30 days, the predator avoidance behavior was monitored and data were presented as (G) average speed, (H) predator approaching time, (I) freezing time movement ratio, (J) swimming time movement ratio, (K) rapid movement time ratio, and (L) average distance to separator. Data are expressed as mean and analyzed by the Mann–Whitney test (n = 30).

Comparison of the conspecific social interaction and shoaling between control and 50 ppb PbCl2-treated fish. After PbCl2 exposure, the conspecific social interaction was monitored and the data are presented as (A) interaction time percentage, (B) longest duration in the separator side, (C) average speed, and (D) average distance to the separator. The data are expressed as the mean values and analyzed by the Mann–Whitney test (n = 30; * p ≤ 0.05). For the shoaling test, after PbCl2 exposure, the shoaling behavior was monitored at 30 days post-treatment and the data are presented as (E) average speed, (F) time in the top duration, (G) average inter-fish distance, (H) average distance to the center of the tank, (I) average shoal area, and (J) average nearest neighbor distance. Data are expressed as the mean values and analyzed by the Mann–Whitney test (n = 30; ** p ≤ 0.01).

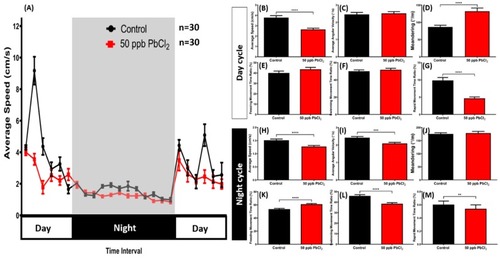
Evaluation of the circadian rhythm locomotor activity for control and chronic PbCl2-treated fish (50 ppb, red). (A) Circadian locomotor activity patterns of average speed; (B) average speed; (C) average angular velocity; (D) meandering; (E) freezing movement time ratio; (F) swimming movement time ratio; and (G) rapid movement ratio during the light cycle; (H) average speed; (I) average angular velocity; (J) meandering; (K) freezing movement time ratio; (L) swimming movement time ratio; and (M) rapid movement ratio during the dark cycle. The data are expressed as mean ± SEM and analyzed by the Mann–Whitney Test (n control fish = 18; n PbCl2-treated fish = 18; ** p < 0.01, *** p < 0.001, **** p < 0.0001).

Passive avoidance task to test the short-term memory of fish treated with different exposure durations in 50 ppb of PbCl2. (A) An illustration that shows the principle of the shuttle box experiment. Twenty-four hours after the training session, we tested the latency for the fish to enter the dark compartment equipped with an electrical shock. Latency of fish treated with PbCl2 (50 ppb) after 4 days (B), 14 days (C), and 30 days (D) after training. Data are expressed as mean ± SEM values and analyzed by two-way ANOVA (n = 10; ** p ≤ 0.01).

Comparison of the color preference between control and PbCl2-exposed fish (50 ppb for 30 days). The combinations of four colors are (A) green/blue, (B) green/yellow, (C) red/blue, (D) red/yellow, (E) green/red, and (F) blue/yellow. Data are expressed as mean ±SEM values and analyzed by two-way ANOVA (n = 16; * p ≤ 0.05, ** p ≤ 0.01, **** p ≤ 0.0001).

Biochemical parameters of the control and 50 ppb PbCl2-exposed fish. The levels of biomarkers, including (A) ROS (reactive oxygen species), (B) SOD (superoxide dismutase), (C) acetylcholine, (D) acetylcholine esterase, (E) melatonin, (F) dopamine, (G) serotonin, (H) GABA, (I) cortisol, (J) MDA (malondialdehyde), (K) HIF-1α, and (L) catecholamine were measured. Data are expressed as mean values (n = 5; * p ≤ 0.05, *** p ≤ 0.001 tested by t-test).

Schematic representation of the biochemical and behavioral signatures detected in chronic and low dose PbCl2-exposed zebrafish. The signatures of biochemical (blue) and behavioral (pink) tests are summarized (↑: upregulated, ↓: down regulated).

Acknowledgments
This image is the copyrighted work of the attributed author or publisher, and ZFIN has permission only to display this image to its users. Additional permissions should be obtained from the applicable author or publisher of the image. Full text @ Int. J. Mol. Sci.