
Image
|
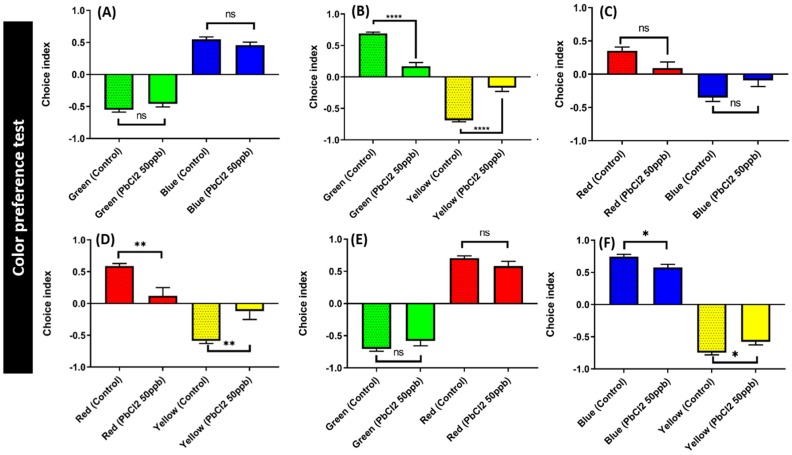
Figure Caption
Figure 8
Comparison of the color preference between control and PbCl2-exposed fish (50 ppb for 30 days). The combinations of four colors are (
Acknowledgments
This image is the copyrighted work of the attributed author or publisher, and
ZFIN has permission only to display this image to its users.
Additional permissions should be obtained from the applicable author or publisher of the image.
Full text @ Int. J. Mol. Sci.