
Image
|
Figure Caption
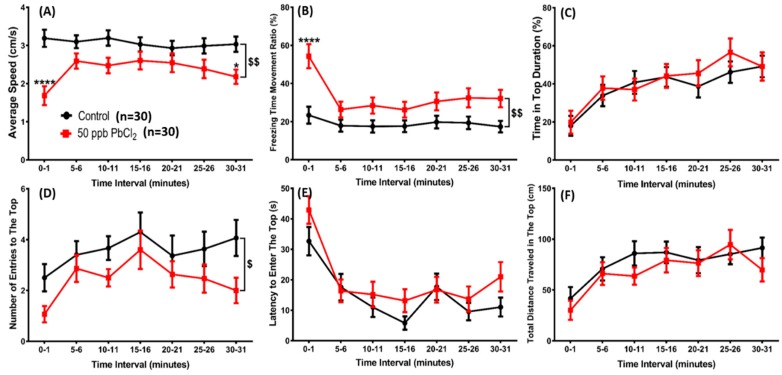
Figure 3
Comparison of behavioral endpoints in the novel tank exploration test among 30-day 50 ppb PbCl2-exposed groups and a control group. Six parameters were evaluated: (
Acknowledgments
This image is the copyrighted work of the attributed author or publisher, and
ZFIN has permission only to display this image to its users.
Additional permissions should be obtained from the applicable author or publisher of the image.
Full text @ Int. J. Mol. Sci.