FIGURE SUMMARY
Title

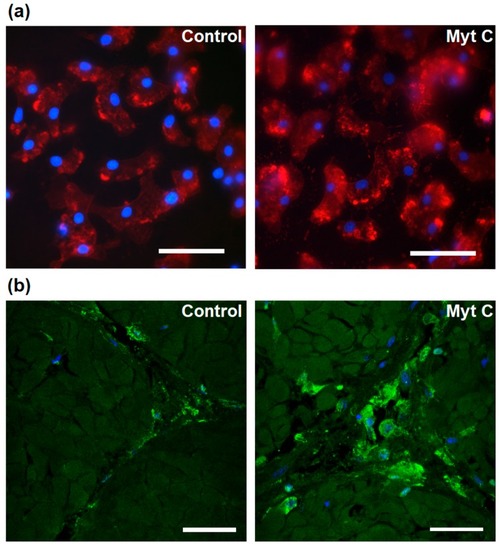
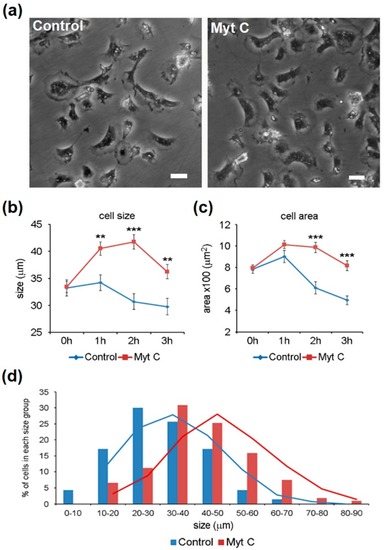
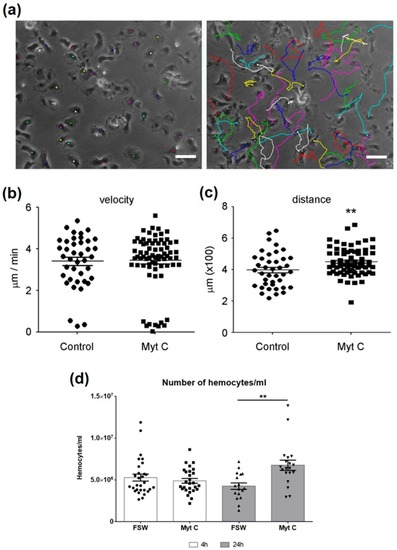
Transcriptomic Analysis Reveals the Wound Healing Activity of Mussel Myticin C

Authors
Rey-Campos, M., Moreira, R., Romero, A., Medina-Gali, R.M., Novoa, B., Gasset, M., Figueras, A.
Source
Full text @ Biomolecules

(a) Enrichment analysis of differentially expressed genes (DEGs). Bars represent the significant changes of proportion between the percentage of sequences in the DEG list and the transcriptome. (b) KEGG (Kyoto Encyclopedia of Genes and Genomes) pathways related to the regulated transcripts after a myticin C treatment.

(a) Differential interference contrast (DIC) images of live hemocytes 3 h after stimulation with myticin C. Actin is stained in red and nuclei in blue. Scale bar = 25 µm. (b) Immunofluorescence of mussel adductor muscle. Actin is stained in green and nuclei in blue. Scale bar = 25 µm.

(a) Appearance of cells after 2 h of treatment with myticin C. Cell size analysis using (b) maximum length and (c) area measurements. Asterisks indicates significant differences at p < 0.01 (**) and p < 0.001 (***). (d) Distribution of cells in different size groups after 3 h of stimulation.

(a) Tracking of individual cell movements. The displacement of single cells is marked with a different color. Scale bar 50 µm. (b) Mean velocity of cell displacement (µm/min) after 3 h of stimulation. (c) Accumulated distance traveled by the cells during 3 h. (d) Number of hemocytes counted after 4 h and 24 h of in vivo treatment with myticin C. Asterisks denote significant differences at p < 0.01 (**).

(a) Number of hemocytes in mussel muscle 4 h and 24 h after an injury. Asterisks indicate significant differences at p < 0.01 (**) and p < 0.001 (***). (b) Histological sections of healthy or injured adductor muscle using hematoxylin and eosin (HE) staining. Note the increase in the number of hemocytes in the damaged area. (c) Western blot of myticin C in samples of hemocytes extracted from naïve and injured mussels. Asterisks indicates significant differences at p < 0.01 (**). (d) Immunofluorescence of muscle sections of healthy or injured muscles. Triple labeling of actin (green), myticin C (red), and 4′,6-diamidino-2-phenylindole (DAPI) (blue). Bar scale represents 25 μm.

(a) Progress of the closure of the gap in HaCaT cells. (b) Percentage of wound closing 48 h after myticin C treatment. Asterisks indicate significant differences at p < 0.01 (**). (c) Tail regeneration, compared to time 0 (tail amputation), four days after the treatment. Asterisks indicate significant differences at p < 0.001 (***). (d) Images of a representative wild-type (WT) zebrafish larva after the tail fin amputation, and its regeneration after the treatment.

Acknowledgments
This image is the copyrighted work of the attributed author or publisher, and ZFIN has permission only to display this image to its users. Additional permissions should be obtained from the applicable author or publisher of the image. Full text @ Biomolecules