IMAGE

Figure 4

ID
ZDB-IMAGE-200314-63
Source
Figures for Rey-Campos et al., 2020
Image
Figure Caption

Figure 4

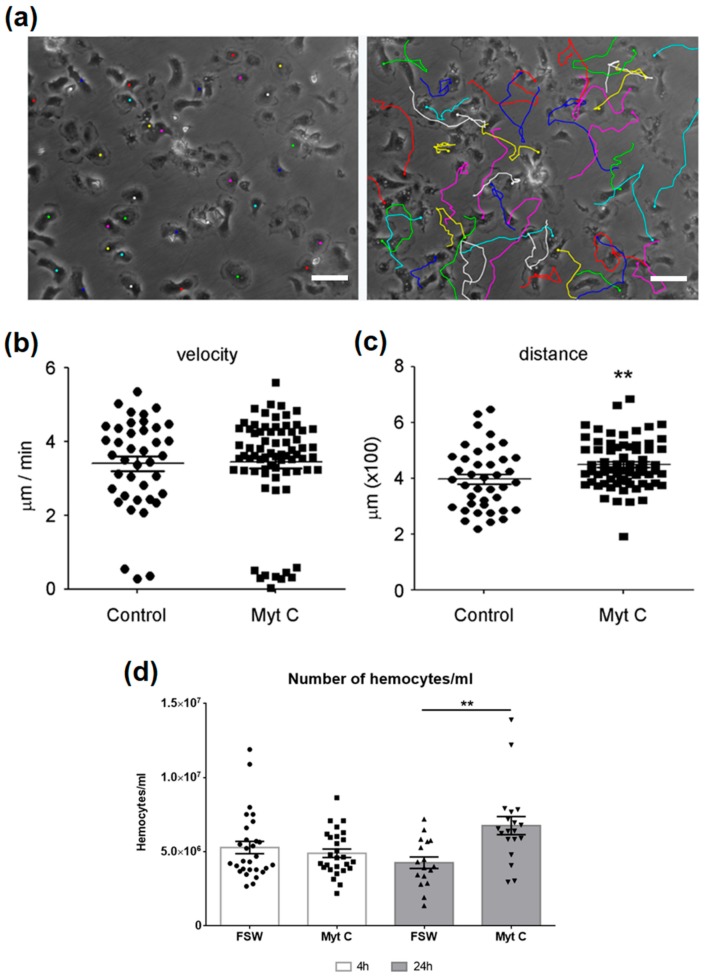
(a) Tracking of individual cell movements. The displacement of single cells is marked with a different color. Scale bar 50 µm. (b) Mean velocity of cell displacement (µm/min) after 3 h of stimulation. (c) Accumulated distance traveled by the cells during 3 h. (d) Number of hemocytes counted after 4 h and 24 h of in vivo treatment with myticin C. Asterisks denote significant differences at p < 0.01 (**).

Acknowledgments
This image is the copyrighted work of the attributed author or publisher, and ZFIN has permission only to display this image to its users. Additional permissions should be obtained from the applicable author or publisher of the image. Full text @ Biomolecules