FIGURE SUMMARY
Title

Slc7a14 Is Indispensable in Zebrafish Retinas

Authors
Zhuang, Y.Y., Xiang, L., Wen, X.R., Shen, R.J., Zhao, N., Zheng, S.S., Han, R.Y., Qu, J., Lu, F., Jin, Z.B.
Source
Full text @ Front Cell Dev Biol

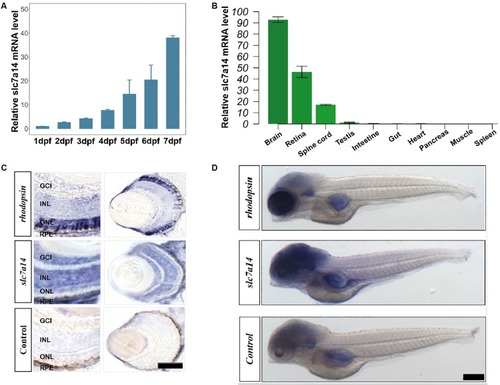
Spatiotemporal expression pattern of slc7a14 in zebrafish. (A) The slc7a14 expression increased remarkably from 1 to 7 dpf. (B) Spatial expression pattern of slc7a14 in 3-month-old adult male zebrafish. (C)In situ hybridization (ISH) of slc7a14 in retinas and eyes. ONL, outer nuclear layer; INL, inner nuclear layer; GCL, ganglion cell layer; RPE, retinal pigment epithelium. Scale bar = 50 μm. (D) ISH of slc7a14 in embryos. Scale bar = 100 μm.

EXPRESSION / LABELING:
Gene:
Fish:
Anatomical Terms:
Stage Range: Prim-5 to Adult

Morphology of slc7a14-deficient zebrafish morphants. (A) Lateral view of zebrafish larvae. Embryos injected with doses of 4.0 and 6.0 ng MOs exhibited apparent microphthalmia. Scale bar = 200 μm. (B) Magnified view of larval eyeballs showing the significant reductions in eye area with high-dose MOs. Scale bar = 100 μm. (C) Vertical view of larval eyeballs showing the reductions in eye axis length with high-dose MOs. Scale bar = 100 μm. (D,E) Quantification of eye axis length and the axis-to-body length ratio. N = 46 in each group. Bar plots are shown as the mean ± s.e.m. Data was analyzed using One-way ANOVA followed by Tukey’s post hoc test, ∗∗P < 0.01, ∗∗∗P < 0.001 significantly different from control 6.0 ng group.

Immunostaining of zpr-1, zpr-2, and zpr-3 in slc7a14-deficient morphants. (A) In the peripheral retina, the high-dose slc7a14-MOs led to sharp reductions in zpr-3. Weaker fluorescence signals were detected in the high-MO dose groups (slc7a14 4.0 ng and slc7a14 6.0 ng) than in the control group. (B) Statistical results for zpr-3 (n = 10 for each group). (C) The high-dose slc7a14-MOs led to significant reductions in zpr-2. There were few fluorescence signals in the peripheral retina in the high-MO dose group (slc7a14 6.0 ng). The RPE in the low-MO dose group (slc7a14 2.0 ng) was relatively normal compared to that in the wild-type group and control group. (D) Statistical results for zpr-2 (n = 10 for each group). (E) No significant changes were found in cone photoreceptors. (F) Statistical results for zpr-1 (n = 5 for each group). Scale bar = 50 μm. Bar plots were shown as the mean ± s.e.m. T-test was performed between the two groups. P < 0.05, ∗∗P < 0.01.

Knockdown of slc7a14 led to increased apoptosis in the zebrafish retina. TUNEL assay was used to detect apoptosis in larval retinas at 3 and 5 dpf. (A,B)Slc7a14 knockdown resulted in significant increase of TUNEL + cells in the retina including GCL, INL, ONL and RPE at 3 dpf (A) and 5 dpf (B). Scale bars = 50 μm. (C,D) Statistical results for the numbers of TUNEL positive cell at 3 dpf (n = 6 for each group) and at 5 dpf (n = 3 for each group). Bar plots were shown as the mean ± s.e.m. T-test was performed between the two groups. P < 0.05, ∗∗∗P < 0.001.

Slc7a14-deficient zebrafish morphants showed defective visual behaviors. (A,B) VMR testing in slc7a14-deficient zebrafish morphants. Larvae injected with slc7a14-MO (6.0 ng) showed a weaker ON response and a significantly attenuated OFF response compared to control larvae. N = 12 in each group. (C,D) Quantification of the VMR. N = 12 in each group. (C) Larvae injected with slc7a14 MO (6.0 ng) showed a reduced ON response compared with control larvae. (D) Compared with control larvae, larvae injected with 4.0 ng MO and 6.0 ng slc7a14-MOs exhibited markedly reduced OFF responses. (E,F) OKR testing demonstrated significant reductions in eye movement in the slc7a14-deficient zebrafish morphants compared to the control zebrafish. N = 10 in each group. VMR testing and OKR testing were repeated three times, respectively. Data was analyzed using One-way ANOVA followed by Games–Howell test, P ≤ 0.05, ∗∗∗P < 0.001 significantly different from control 6.0 ng group.

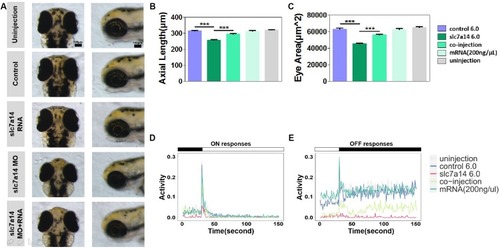
Slc7a14 mRNA compensation rescued the phenotypes in slc7a14-deficient morphants. (A) Magnified vertical and lateral views of larval eyeballs. Larvae injected with slc7a14 MO and full-length slc7a14 mRNA showed normal-sized eyeballs at 3 dpf. Scale bar = 100 μm. (B,C) Statistical results for the axial length and ocular area. N = 30 in each group. (D,E) VMR testing showed dramatic recovery of both the ON and OFF responses in slc7a14-deficient zebrafish compensated with mRNA compared to slc7a14-deficient zebrafish without compensation. N = 12 in each group. Rescue experiments were repeated three times. Bar plots are shown as the mean ± s.e.m. Data was analyzed using One-way ANOVA followed by Tukey’s post hoc test, ∗∗∗P < 0.001 significantly different from slc7a14 6.0 ng group.

Acknowledgments
This image is the copyrighted work of the attributed author or publisher, and ZFIN has permission only to display this image to its users. Additional permissions should be obtained from the applicable author or publisher of the image. Full text @ Front Cell Dev Biol