FIGURE SUMMARY
Title

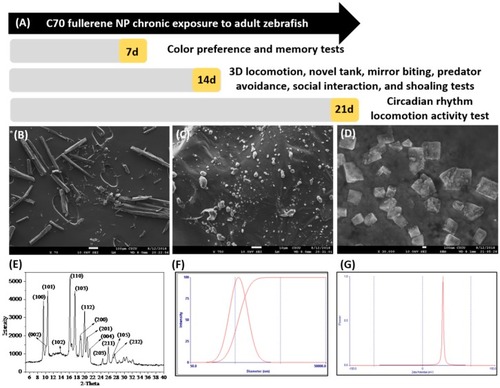
Behavioral Impairments and Oxidative Stress in the Brain, Muscle, and Gill Caused by Chronic Exposure of C70 Nanoparticles on Adult Zebrafish

Authors
Sarasamma, S., Audira, G., Samikannu, P., Juniardi, S., Siregar, P., Hao, E., Chen, J.R., Hsiao, C.D.
Source
Full text @ Int. J. Mol. Sci.

(A) Overview of the experimental design and time points for chronic exposure of C70 fullerene nanoparticles (NPs) to adult zebrafish. For chronic toxicity, we measured color preference and short-term memory at 7 days post-exposure (dpe). 3D locomotion, novel tank, mirror biting, predator avoidance, social interaction, and shoaling tests were given at 14 dpe. The circadian rhythm test was given at 21 dpe. After all behavior tests, fish were dissected and subjected to biochemical assays by 22 dpe. Characterization of the C70 NPs used in this study: (B) SEM micrograph of C70 NPs stock solution in the absence of solvents, (C) C70 NPs dissolved in DMSO showing wide disparity in aggregation, (D) high magnification scanning electron micrograph showing the size of C70 NPs used in this study, and (E) X-ray diffraction patterns of the crystal quality of the C70 NPs. (F) The particle size distribution of 0.5 ppm C70 NPs in DMSO was measured by dynamic light scattering. C70 NP suspensions were sonicated prior to measurement to resuspend the large particles and assess changes in large aggregate status. (G) The zeta potential value of C70 NPs is estimated at −34.0 mV.

Comparison of behavior endpoints between the untreated control and C70 NP-exposed zebrafish in 3D locomotion and novel tank tests after 14-day exposure. (A) Average speed, (B) average angular velocity, (C) time in top duration, (D) meandering, (E) freezing time movement ratio, and (F) rapid movement time ratio were analyzed for the 3D locomotion test. For the novel tank test, (G) average speed, (H) freezing time movement ratio, (I) time in top duration, (J) number of entries to the top, (K) latency to enter the top, and (L) total distance traveled in the top were analyzed. The data are expressed as the median with interquartile range. The 3D locomotion test data were analyzed by the Kruskal–Wallis test, with Dunn’s multiple comparisons test as a follow-up test (n = 36 for both control and treatment groups). The novel tank test data were analyzed by two-way ANOVA with Geisser–Greenhouse correction (n = 40 for the untreated control; n = 30 for the 0.5 ppm C70 NP-exposed fish; n = 23 for the 1.5 ppm C70 NPs-exposed fish; * p < 0.05, ** p < 0.01, *** p < 0.001, **** p < 0.0001).

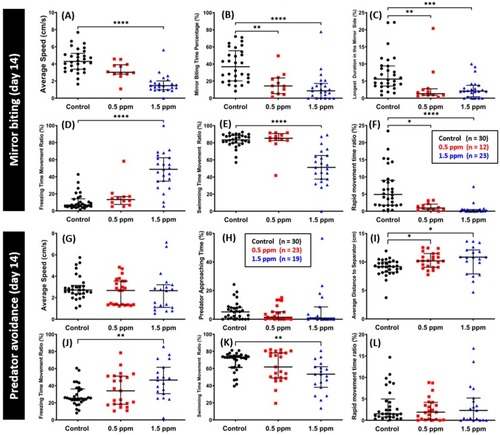
Comparison of mirror biting and predator avoidance behavior endpoints between the untreated control and C70-exposed fish after 14-day exposure. (A) Average speed, (B) mirror biting time percentage, (C) longest duration in the mirror side, (D) freezing time movement ratio, (E) swimming time movement ratio, and (F) rapid movement time ratio were analyzed for the mirror biting assay (n = 30 for the untreated control; n = 12 for the 0.5 ppm C70 NP-exposed fish; n = 23 for the 1.5 ppm C70 NP-exposed fish). For predator avoidance test, the (G) average speed, (H) predator approaching time ratio, (I) average distance to separator, (J) freezing time movement ratio, (K) swimming time movement ratio, and (L) rapid movement time ratio were analyzed (n = 30 for the untreated control; n = 23 for the 0.5 ppm C70 NP-exposed fish; n = 19 for the 1.5 ppm C70 NP-exposed fish). The data are expressed as the median with interquartile range and were analyzed by the Kruskal–Wallis test continued with Dunn’s multiple comparisons test as a follow-up test (* p < 0.05, ** p < 0.01, *** p < 0.001, **** p < 0.0001).

Comparison of social interaction and shoaling behavior endpoints between the untreated control and C70 NP-exposed fish after 14-day exposure. (A) Average speed, (B) average distance to separator side, (C) interaction time percentage, and (D) the longest duration in the separator side were analyzed for the social interaction test (n = 30 for the untreated control; n = 12 for the 0.5 ppm C70 NP-exposed fish; n = 19 for the 1.5 ppm C70 NP-exposed fish). For the shoaling test: (E) average speed, (F) time in top duration, (G) average shoal area, (H) average inter-fish distance, (I) average nearest neighbor distance, and (J) average farthest neighbor distance were analyzed (n = 30 for the untreated control; n = 24 for the 0.5 ppm C70 NPs-exposed fish; n = 21 for the 1.5 ppm C70 NPs-exposed fish, with 3 fish for each shoal). The data are expressed as the median with interquartile range and were analyzed by the Kruskal–Wallis test, with Dunn’s multiple comparisons test as a follow-up test (* p < 0.05, ** p < 0.01, *** p < 0.001, **** p < 0.0001).

Comparison of color preferences between the untreated control and 1.5 ppm of C70 NP-exposed fish: (A) green vs. blue combination; (B) green vs. yellow combination; (C) red vs. blue combination; (D) green vs. red combination; (E) red vs. yellow combination; and (F) blue vs. yellow combination. Since all of the data were not normally distributed, they were analyzed using non-parametric Kruskal–Wallis followed by Dunn’s post-hoc test, and p < 0.05 was considered significantly different. The data are presented with mean ± SEM with n = 24, n.s. = not significant, ** p < 0.01.

The short-term memory and circadian rhythm assay for the untreated control and C70 NP-exposed fish after 7- and 21-day exposure, respectively. (A) Schematic showing the experimental protocol for the passive avoidance test. (B) The average training phase latency on zebrafish learning. (C) The memory retention latency for the memory test. The data are expressed as the mean ± SEM and were analyzed by two-way ANOVA with Sidak’s multiple comparisons test as a follow-up test (n = 10 for the untreated control; n = 6 for the C70 NP-exposed fish). (D) Comparison of time chronological changes of the average speed between wild-type and C70 NP-exposed fish in the day and night cycle. The grey area shows the dark period and the unshaded area is the light period. Comparison of (E) average speed, (F) average angular velocity, and (G) meandering at light period. Comparison of (H) average speed, (I) average angular velocity and (J) meandering at the dark period. The data are expressed as the median with interquartile range and were analyzed by Kruskal–Wallis test, with Dunn’s multiple comparisons test as a follow-up test (n = 18 for the untreated control; n = 18 for 0.5 ppm C70 NP-exposed fish; n = 9 for the 1.5 ppm C70 NP-exposed fish; *** p < 0.001, **** p < 0.0001).

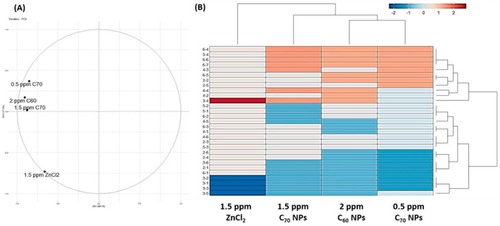
Comparison of behavioral alterations in zebrafish after exposing to either C60 NPs, C70 NPs or ZnCl2. (A) Results obtained from principal component analysis (PCA). (B) Results obtained from hierarchical clustering and heat map analysis.

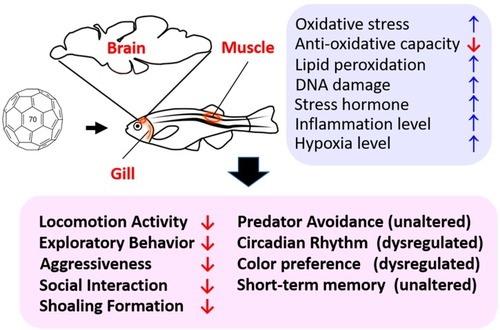
Schematic diagram showing the detrimental effects of chronic exposure of C70 nanoparticles on adult zebrafish. The corresponding behavioral alterations (pink color) and biochemical alterations in the brain tissue (blue color) after C70 nanoparticles exposure are summarized.

Acknowledgments
This image is the copyrighted work of the attributed author or publisher, and ZFIN has permission only to display this image to its users. Additional permissions should be obtained from the applicable author or publisher of the image. Full text @ Int. J. Mol. Sci.