IMAGE

Figure 4

ID
ZDB-IMAGE-191230-91
Source
Figures for Sarasamma et al., 2019
Image
Figure Caption

Figure 4

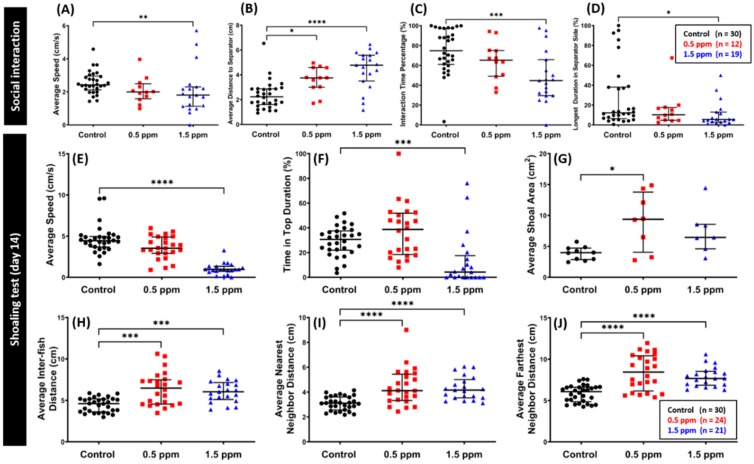
Comparison of social interaction and shoaling behavior endpoints between the untreated control and C70 NP-exposed fish after 14-day exposure. (A) Average speed, (B) average distance to separator side, (C) interaction time percentage, and (D) the longest duration in the separator side were analyzed for the social interaction test (n = 30 for the untreated control; n = 12 for the 0.5 ppm C70 NP-exposed fish; n = 19 for the 1.5 ppm C70 NP-exposed fish). For the shoaling test: (E) average speed, (F) time in top duration, (G) average shoal area, (H) average inter-fish distance, (I) average nearest neighbor distance, and (J) average farthest neighbor distance were analyzed (n = 30 for the untreated control; n = 24 for the 0.5 ppm C70 NPs-exposed fish; n = 21 for the 1.5 ppm C70 NPs-exposed fish, with 3 fish for each shoal). The data are expressed as the median with interquartile range and were analyzed by the Kruskal–Wallis test, with Dunn’s multiple comparisons test as a follow-up test (* p < 0.05, ** p < 0.01, *** p < 0.001, **** p < 0.0001).

Acknowledgments
This image is the copyrighted work of the attributed author or publisher, and ZFIN has permission only to display this image to its users. Additional permissions should be obtained from the applicable author or publisher of the image. Full text @ Int. J. Mol. Sci.