FIGURE SUMMARY
Title

Glucocorticoid Treatment Leads to Aberrant Ion and Macromolecular Transport in Regenerating Zebrafish Fins

Authors
Schmidt, J.R., Geurtzen, K., von Bergen, M., Schubert, K., Knopf, F.
Source
Full text @ Front Endocrinol (Lausanne)

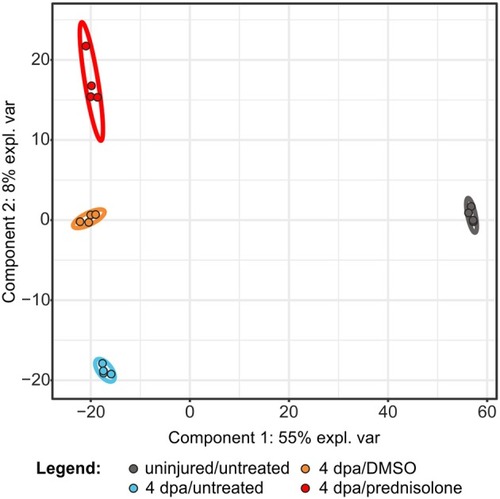
Partial least square discriminant analysis using quantitative values of all identified proteins. expl. var., explained variance.

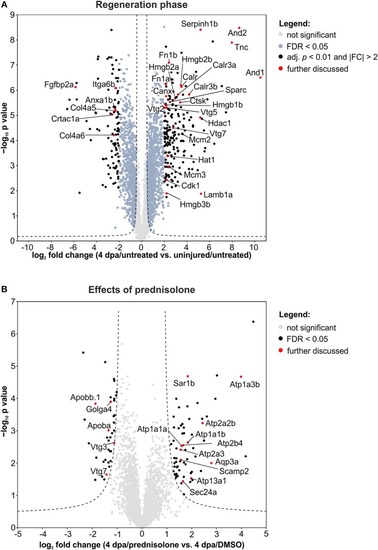
Volcano plots of all quantified proteins for the given analyses with their log2-transformed ratios of the mean centered abundances (fold changes, FC) and –log10-transformed p values (t-test, unpaired, two-sided). Dashed line represents the cut-offs from permutation-based FDR validation to identify significantly altered abundances (FDR < 0.05). Proteins highlighted in red are discussed in the text. (A) Proteins affected in the regeneration phase. Significantly altered proteins were further filtered by adj. p < 0.01 (Benjamini-Hochberg) and absolute FC > 2. (B) Proteins affected by the prednisolone treatment. No further filtering for significantly altered proteins was done.

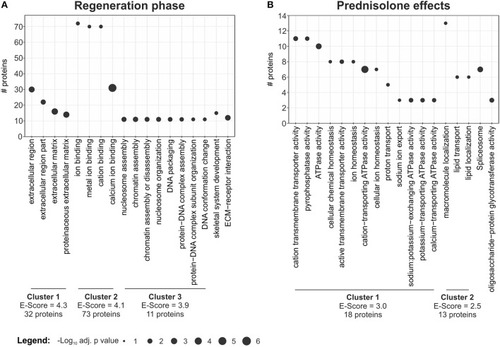
Term enrichment and clustering. Extracted enriched terms and clusters for the given analyses. Significance for enrichment (-log10-transformed adj. p value) and number of included proteins for each term are indicated. The enrichment score for each cluster was calculated using DAVID. For clustering terms were filtered for EASE < 0.05, but only terms with adj. p < 0.01 are reported. (A) Enriched terms and clusters for proteins affected in the regeneration phase. (B) Enriched terms and clusters for proteins affected by the prednisolone treatment.

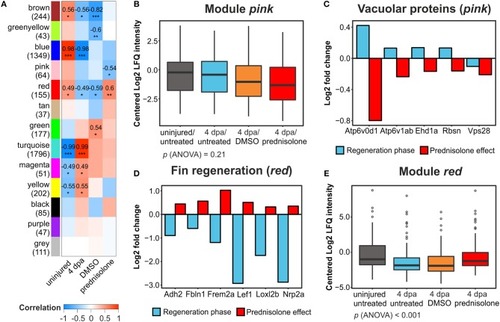
Weighted gene correlation network analysis of all filtered proteins. (A) Module-treatment relationship. Coefficients are indicated for |cor| > 0.4 and p < 0.05 with significance levels *p < 0.05, **p < 0.01, and ***p < 0.001. Numbers in brackets at the module names indicate the number of proteins in the modules. (B) Mean centered log2-transformed intensities of all proteins and treatments from the module pink. (C) Log2-transformed fold changes of 5 vacuolar proteins in the module pink identified from functional annotation analysis. (D) Log2-transformed FC of six proteins involved in fin regeneration and mesenchymal development in the module red identified from functional annotation analysis. (E) Mean centered log2-transformed intensities of all proteins and treatments from the module red.

col1a1b expression in prednisolone treated fins at 4 dpa. Scale bar 200 μm. n = 4.

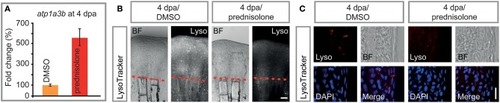
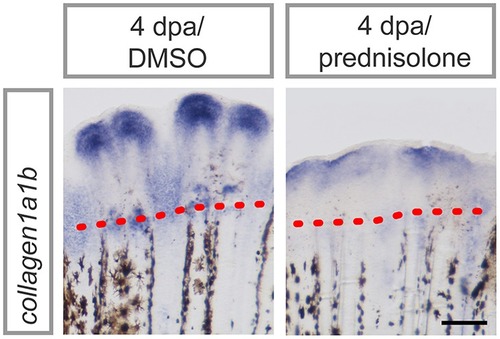
Impaired ATPase expression and lysosomal acidification. (A) qRT-PCR on atp1a3b, a sodium/potassium ATPase subunit. Mean and SD (technical error). (B) Live whole mount view of LysoTracker stained 4 dpa fin regenerates. Scale bar 100 μm. n = 5. (C) Longitudinal section view of fixed LysoTracker stained fin regenerates at 4 dpa. Scale bar 10 μm. BF, brightfield; Lyso, LysoTracker. n = 5, 5 sections minimum per fish.

Acknowledgments
This image is the copyrighted work of the attributed author or publisher, and ZFIN has permission only to display this image to its users. Additional permissions should be obtained from the applicable author or publisher of the image. Full text @ Front Endocrinol (Lausanne)