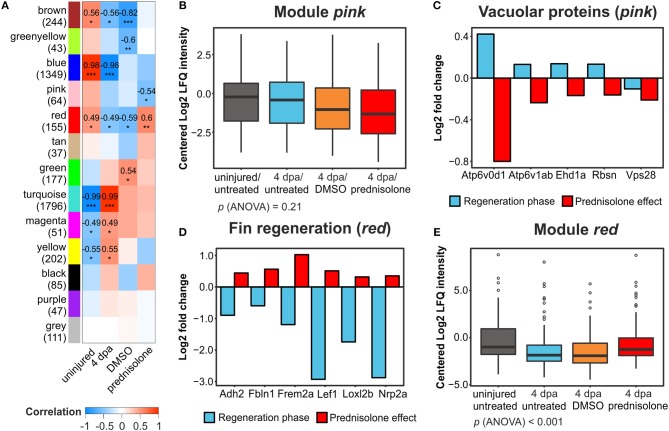
Weighted gene correlation network analysis of all filtered proteins. (A) Module-treatment relationship. Coefficients are indicated for |cor| > 0.4 and p < 0.05 with significance levels *p < 0.05, **p < 0.01, and ***p < 0.001. Numbers in brackets at the module names indicate the number of proteins in the modules. (B) Mean centered log2-transformed intensities of all proteins and treatments from the module pink. (C) Log2-transformed fold changes of 5 vacuolar proteins in the module pink identified from functional annotation analysis. (D) Log2-transformed FC of six proteins involved in fin regeneration and mesenchymal development in the module red identified from functional annotation analysis. (E) Mean centered log2-transformed intensities of all proteins and treatments from the module red.
Acknowledgments
This image is the copyrighted work of the attributed author or publisher, and
ZFIN has permission only to display this image to its users.
Additional permissions should be obtained from the applicable author or publisher of the image.
Full text @ Front Endocrinol (Lausanne)
Your Input Welcome
Thank you for submitting comments. Your input has been emailed to ZFIN curators who may contact you if
additional information is required.
Oops. Something went wrong. Please try again later.