FIGURE

Figure 2

ID
ZDB-FIG-191230-1537
Publication
Schmidt et al., 2019 - Glucocorticoid Treatment Leads to Aberrant Ion and Macromolecular Transport in Regenerating Zebrafish Fins
Other Figures
All Figure Page
Back to All Figure Page
Figure 2

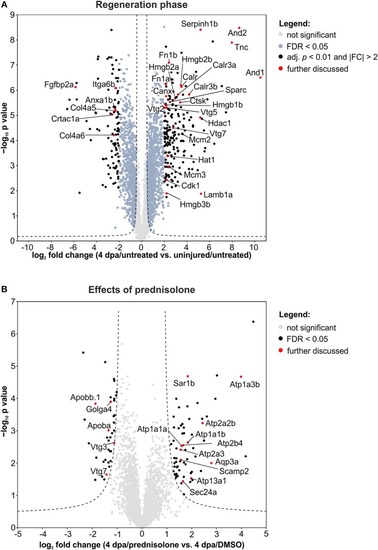
Volcano plots of all quantified proteins for the given analyses with their log2-transformed ratios of the mean centered abundances (fold changes, FC) and –log10-transformed p values (t-test, unpaired, two-sided). Dashed line represents the cut-offs from permutation-based FDR validation to identify significantly altered abundances (FDR < 0.05). Proteins highlighted in red are discussed in the text. (A) Proteins affected in the regeneration phase. Significantly altered proteins were further filtered by adj. p < 0.01 (Benjamini-Hochberg) and absolute FC > 2. (B) Proteins affected by the prednisolone treatment. No further filtering for significantly altered proteins was done.

Expression Data

Expression Detail
Antibody Labeling
Phenotype Data

Phenotype Detail
Acknowledgments
This image is the copyrighted work of the attributed author or publisher, and ZFIN has permission only to display this image to its users. Additional permissions should be obtained from the applicable author or publisher of the image. Full text @ Front Endocrinol (Lausanne)