FIGURE SUMMARY
Title

Effects of a Flavonoid-Rich Extract from Citrus sinensis Juice on a Diet-Induced Obese Zebrafish

Authors
Montalbano, G., Mania, M., Guerrera, M.C., Laurà, R., Abbate, F., Levanti, M., Maugeri, A., Germanà, A., Navarra, M.
Source
Full text @ Int. J. Mol. Sci.

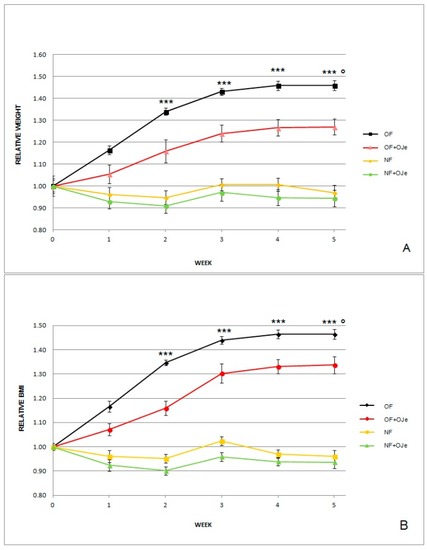
Effects of the orange juice extract (OJe) on both normalized body weight (BW) and body mass index (BMI) in overfed (OF) and normally fed (NF) zebrafish. Graphs show the fold change of BW (A) and BMI (B) values recorded each week during the five experimental weeks. Results are expressed as mean ± SD of data collected from 15 animals per experimental group. BW and BMI relative values were extrapolated from the data detected in the fish at T0 for each group, which were arbitrarily expressed as 1. At T0, the BW values were the following (g): 0.44 in OF, 0.49 in OF supplemented with OJe (OF + OJe), 0.54 in NF, and 0.45 in NF supplemented with OJe (NF + OJe) groups. The BMI values (g/cm2) at T0 were 0.027 and 0.030 in the OF and OF + OJe groups, respectively, while they were 0.031 and 0.030 in the NF and NF + OJe groups. *** p < 0.001 vs. OF + OJe; ° p < 0.001 vs. NF.

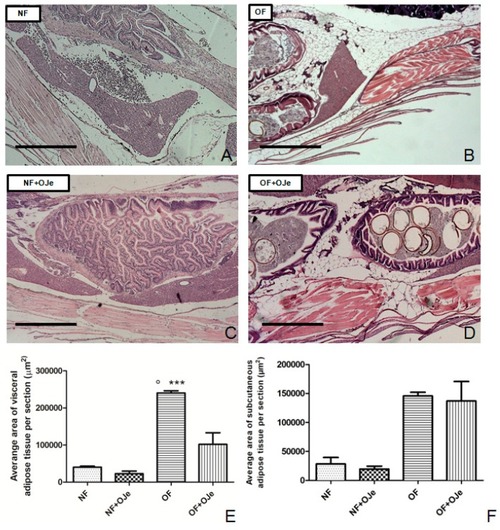
OJe reduced the development of adipose tissue in overfed zebrafish. Histological examination of abdominal tissue of sagittal sections, performed through hematoxylin and eosin staining, showed the rise of visceral (E) and subcutaneous (F) fat depots in the OF group (B) but not in the NF group (A). Five weeks of OJe treatment reduced visceral adipose tissue area in OF fish (D,E) without affecting the subcutaneous area (D,F). The morphometric fat analysis showed that NF fish had no significant changes in either visceral (C,E) or subcutaneous (C,F) adipose tissue areas. Photos (AC) are representative of that (three per section) taken in 10 fish per group. The values in graphs (E) and (F) are expressed in µm2 of adipose tissue per section. Scale bars correspond to 1 mm. Data presented in the graphs are the mean ± SD of 10 fish per each group. *** p < 0.001 vs. respective counterpart; ° p < 0.001 vs. NF.

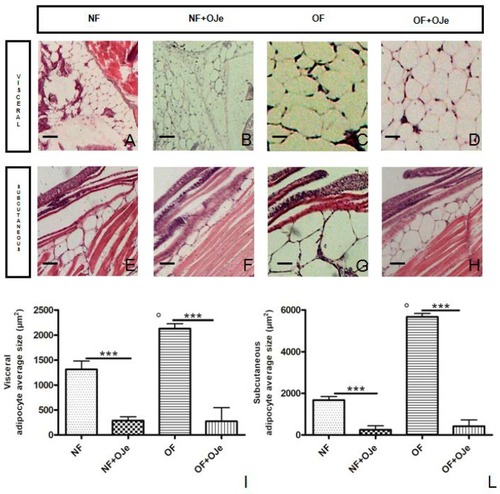
Effect of OJe on visceral and subcutaneous adipocyte size. Histological features of abdominal adipose tissue in sagittal sections (hematoxylin and eosin staining) showing visceral (AD,I) and subcutaneous (EH,L) adipocyte size in the four experimental groups. OJe treatment significantly reduced both visceral (AD,I) and subcutaneous (EH,L) average adipocyte size in both NF and OF fish. Photos (AH) are representative of that (three per section) taken in 10 fish per group. Bar graphs show the results of the morphometric analysis of fat performed in both visceral (I) and subcutaneous (L) adipocyte average size in the four experimental groups (NF, NF + OJe, OF, and OF + OJe). Scale bars correspond to 20 µm. Results from the morphometric analysis in graphs (I) and (L) are expressed in µm2 of adipocyte size and expressed as mean ± SD of 15 fish per each group. *** p < 0.001 vs. respective counterparts; ° p < 0.001 vs. NF.

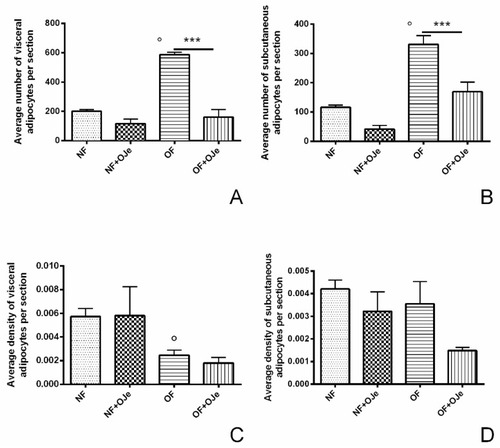
OJe reduced adipocyte number and density in OF zebrafish. Morphometric analysis of visceral (A) and subcutaneous (B) fat displays a reduction in the number (A,B) of adipocytes in OF + OJe fish compared with OF untreated ones, while their density was statistically reduced only at the subcutaneous level (D) but not at visceral one (C). Values reported in the graphs are expressed in µm2 of adipose tissue per section and represent the mean ± SD of 10 animals per each group. *** p < 0.001 vs. respective counterparts; ° p < 0.001 vs. NF.

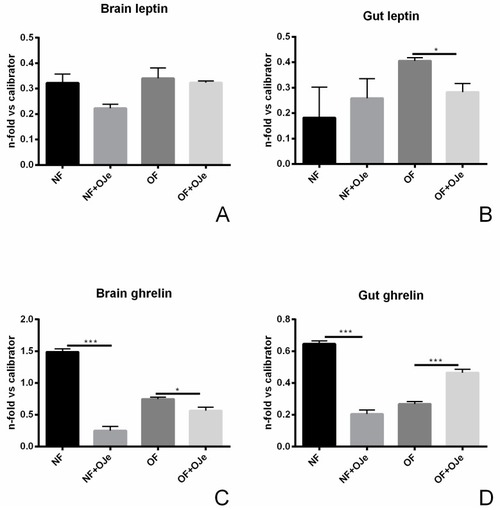
Effects of OJe on the expression of obesity-related genes. The expression of leptin A (A,B) and ghrelin (C,D) was evaluated by qPCR in both brains (A,C) and guts (B,D). Relative quantities of mRNA were calculated using the 2−ΔΔCt quantification method. Results are expressed as fold change in OJe-treated fish compared to untreated ones, after normalization to β-actin. Data represent the mean ± SD of five animals for each group. * p < 0.05, ** p < 0.01, *** p < 0.001 vs. respective counterparts.

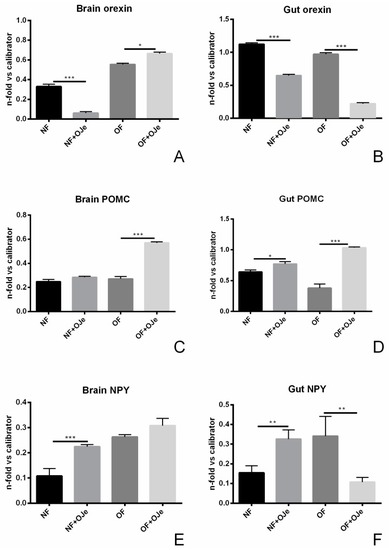
OJe is capable of modulating the expression of orexin, pro-opiomelanocortin (POMC), and neuropeptide Y (NPY). Brain (A,C,E) and gut (B,D,F) tissues from OJe-treated and -untreated fish were processed for qPCR analyses in order to investigate orexin (A,B), POMC (C,D), and NPY (E,F) gene expression. The levels of mRNA were calculated by the 2−ΔΔCt relative quantification method. Results are expressed as fold change in OJe-treated fish compared to those found in untreated ones, after normalization to β-actin. Data represent mean ± SD of five animals per each group. * p < 0.05, ** p < 0.01, *** p < 0.001 vs. respective counterparts.

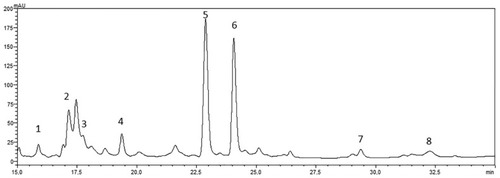
Reversed-phase high-performance liquid chromatography coupled with diode array detection (RP-HPLC-DAD) separation of flavonoids present in OJe. UV–Vis spectrum of the eluted molecules was monitored between 200 and 800 nm. The chromatogram was recorded at 278 nm. Flavonoids corresponding to peaks 1–7, expressed in milligrams (mg) per liter (L) of aqueous extract (mg/L), are the following: (1) lucenin-2 (6.2); (2) vicenin-2 (16.1); (3) lucenin-2-4′-methyl ester (9.5); (4) eriocitrin (11.9); (5) narirutin (62.8); (6) hesperidin (56.4); (7) sinensetin (0.52); (8) nobiletin (5.29).

Acknowledgments
This image is the copyrighted work of the attributed author or publisher, and ZFIN has permission only to display this image to its users. Additional permissions should be obtained from the applicable author or publisher of the image. Full text @ Int. J. Mol. Sci.