FIGURE SUMMARY
Title

Possible role of L-form switching in recurrent urinary tract infection

Authors
Mickiewicz, K.M., Kawai, Y., Drage, L., Gomes, M.C., Davison, F., Pickard, R., Hall, J., Mostowy, S., Aldridge, P.D., Errington, J.
Source
Full text @ Nat. Commun.

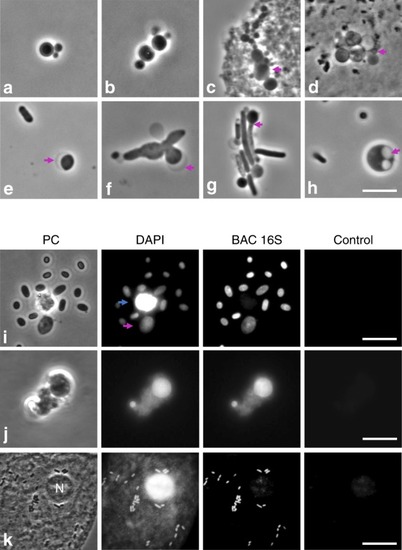
L-form-like structures observed in the urine of various patients. ah Examples of fresh urine samples assessed by phase contrast microscopy. Bundels typical of dividing L-forms (a, b). Magenta arrows in (c) and (d) point to putative L-form bacteria associated with sluffed eukaryotic cells; in (e) and (f) they point at crescent shaped bulges, reminiscent of the outer membrane in L-forms of Gram-negative bacteria; in (g) a possible intermediate stage between walled and L-form is marked; and in (h), internal membrane vesicles are evident. ik Examples of fixed samples assessed by fluorescence in situ hybridisation (FISH). Patient samples were fixed with paraformaldehyde and stained with DAPI and a fluorescently labelled DNA probe against bacterial 16S rRNA (BAC 16S). To show the specificity of DAPI and the probe staining an image was acquired in the red channel, which did not produce significant fluorescence (Control). i Two L-form-like structures were observed among several likely walled bacteria. One of the objects stained both with the bacterial probe and DAPI (magenta arrow) while the other one, only with DAPI (blue arrow). j Example of L-form-like structures of varied size that stained with the bacterial probe. k Example showing a eukaryotic cell in urine in the same field of view as numerous bacteria. The bacterial DNA and the nucleous of the eukaryotic cell (n) both stained with DAPI but the BAC 16S probe only associated with the bacterial cells, demonstrating the specificity of the probe. Scale bars = 5 µm, apart form panel (k), where the scale bar = 15 µm

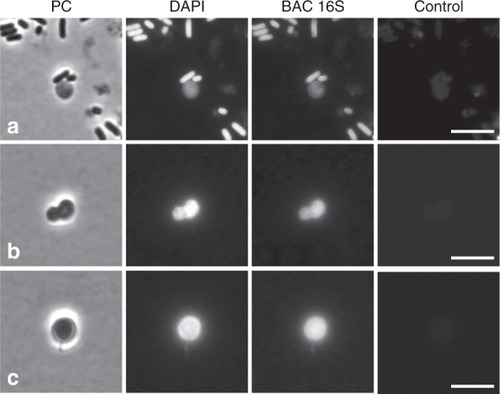
Examples of L-form-like structures observed in the patient UTI343 urine. ac Example images taken before (a) and during (b, c) the treatment with phosphomycin, assessed by phase contrast and FISH. Scale bar = 5 µm

E. coli transition from rod to L-form and back on osmoprotective medium and in urine. Magenta arrows indicate individual bacteria, which were followed in time lapse and described in details in the main text. a Transition of strain ST782 from walled to L-form on osmoprotective medium (LM: L-form media) in the presence of 0.4 mg/ml phosphomycin. b Growth of strain ST782 in the presence of 0.4 mg/ml phosphomycin on non-osmoprotective medium (NA: nutrient agar). c ST782 transition from L-form to walled on osmoprotective medium (LM) after phosphomycin was removed. Time lapse over 5 h. Forty-minute increments are shown on the left-hand side of each image. dg Survival of L-forms in urine and reversion to the walled state. d Phase contrast image of ST144 L-forms, which survived in urine overnight in the presence of phosphomycin. Viability of L-forms in urine was demonstrated by plating on NA (e) and LM (f). Growth was detectable only on osmoprotective medium (f) after 24 h incubation at 37 °C. g Microscopic appearance of bacteria detected in (f). h Model showing L-form switching as a mechanism for the recurrence of bacterial infections. Bacteria causing UTI are treated with cell-wall-targeting antibiotics. This leads to elimination of the cell wall and emergence of L-forms, which are not detectable by standard clinical culture methods. Following antibiotic treatment the bacteria can regenerate the wall and potentially cause recurrence of a full-blown infection. The bacterial cell wall is indicated with dark purple lines. Panel (h) was created by Katarzyna Mickiewicz. Scale bars = 5 µm

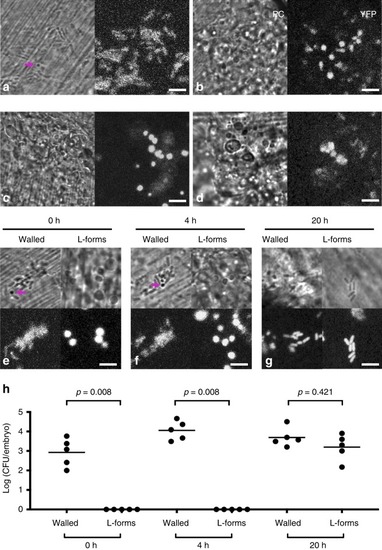
L-form switching in the zebrafish embryo. a, b Walled E. coli ST144-YFP was injected into the tail fin of zebrafish larvae in the presence (b) or absence (a) of 0.4 mg/ml phosfomycin and visualised by phase contrast (PC) or fluorescence microscopy (YFP). The magenta arrow in (a) points to a bacterium that appears to have adopted a round shape in the absence of antibiotic. c, d ST144-YFP E. coli L-forms induced in vitro with 0.4 mg/ml phosfomycin were injected into the tail fins of zebrafish larvae in the presence of 0.4 mg/ml phosfomycin and visualised by microscopy immediately post-injection (c), or following an overnight incubation (d). eg ST144-YFP E. coli walled or in vitro induced L-form bacteria were injected in the absence of the antibiotic and visualised 0 h (e), 4 h (f) or 20 h (g) post infection. h The bacteria were enumerated by homogenising fish embyos and plating out on NA 0, 4 or 20 h post infection. Each circle represents recovered bacteria from an individual larva. Representative data from two independent experiments (one with two and one with three larvae). Mean (horizontal bars) is shown. The p values were determined by non-parametric Mann–Whitney test. Significance was defined as p < 0.05. Scale bars = 5 µm. Source data for Fig. 5h are provided as Source Data file

Acknowledgments
This image is the copyrighted work of the attributed author or publisher, and ZFIN has permission only to display this image to its users. Additional permissions should be obtained from the applicable author or publisher of the image. Full text @ Nat. Commun.