FIGURE SUMMARY
Title

Characterization of biklf/klf17-deficient zebrafish in posterior lateral line neuromast and hatching gland development

Authors
Suzuki, H., Ishizaka, T., Yanagi, K., Sone, R., Sunaga, Y., Ohga, R., Kawahara, A.
Source
Full text @ Sci. Rep.

Primitive erythrocytes were observed in the klf17-deficient embryos. (ad) Production of primitive erythrocytes in the klf17-deficient embryo and in the klf17-morphant embryo at 23 hpf. The number of erythrocytes visualized by the gata1:mRFP transgene was comparable in wild-type embryo (klf17+/+) (a) and the klf17-deficient embryo (klf17uy21/uy21) (b) (ventral view, anterior up), whereas the number of erythrocytes was less in the klf17-morphant embryo (d). Scale bar, 200 μm. (e,f) Haemoglobin production in the klf17-deficient embryos at 36 hpf. Haemoglobin production visualized by o-dianisidine staining (arrowheads) was detected in the wild-type embryo containing an intact allele (klf17+/uy22) embryo and in the klf17-deficient embryo (klf17uy22/uy22) (ventral view, anterior up). After taking pictures, genotyping of individual embryos was performed by genomic PCR. Scale bar, 200 μm. (g) The number of gata1:mRFP-positive cells on the yolk in wild-type (n = 19) and in the klf17-deficient embryos (mutant) (n = 8) were counted. Error bars indicate standard deviation. ns, not significant. (h) The number of gata1:mRFP-positive cells on the yolk in uninjected (n = 14) and in the klf17-molpholino (10 ng)-injected embryos (n = 19) were counted. Asterisk indicates statistical significance. ***P < 0.001. Error bars indicate standard deviation.

Abnormal PLL neuromast deposition in the klf17-deficient embryos. (ad) Lateral line neuromasts stained with 4-Di-2-ASP (Di-ASP). PLL neuromasts were bilaterally stained with Di-ASP. White arrowheads indicate the position of PLL neuromasts on the left side. White asterisks indicate the position of PLL neuromasts on the right side. Term indicates the position of terminal neuromasts. The number of PLL neuromasts (c) and the distance between first and second neuromasts (d) were measured in wild-type (n = 16) and the klf17-deficient embryos (n = 9). Asterisk indicates statistical significance between wild-type and the klf17-deficient embryos. **P < 0.01. ***P < 0.001. Error bars indicate standard deviation. (e,f) Alkaline phosphatase accumulation in the lateral line neuromasts. Arrowheads indicate the position of PLL neuromasts on the left side. Asterisks indicate the position of PLL neuromasts on the right side. (gj) The expression of lateral line genes, klf17 (g,h) and s100t (i,j), was examined by whole-mount in situ hybridization (WISH) at 48 hpf. (g,i) Wild-type embryos (klf17+/uy23). (h,j) klf17-deficient embryos (klf17uy23/uy23). Arrowheads indicate the position of PLL neuromasts on the left side. All pictures showed lateral view, anterior left. After taking pictures, genotyping of individual embryos was performed by genomic PCR. Scale bar, 200 μm.

klf17-deficient embryos failed to hatch during zebrafish embryogenesis. (a,b) Hatching-deficient phenotype in the klf17-deficient embryos at 3 dpf (a) and 6 dpf (b). The klf17-deficient embryo (klf17uy21/uy22) failed to hatch at 3 and 6 dpf, whereas wild-type (klf17+/uy22) embryo hatched until 3 dpf. Scale bar, 1 mm. (ce) Dechorionated-klf17-deficient embryos were alive at 15 dpf. Wild-type embryo (klf17+/+) (c) and the dechorionated- klf17-deficient embryo (klf17uy21/uy22) (d) were both alive at 15 dpf, whereas the klf17-deficient embryo (klf17uy21/uy22) (e) died without hatching. Scale bar, 2 mm. After taking pictures, genotyping of individual embryos was performed by genomic PCR.

Loss of hatching gland cells in the klf17-deficient embryos. (ac) Cross sections of haematoxylin and eosin (HE)-stained embryos at 48 hpf: wild-type (klf17+/+) (a) klf17-deficient embryos: klf17uy21/uy22 (b) and klf17uy22/uy23. (c) Hatching gland cells observed in wild-type embryo were missing in the klf17-deficient embryos. Arrowheads indicate the position of hatching gland cells. Genomic DNA was isolated from individual caudal fins, with genotyping was performed by genomic PCR. Scale bar, 100 μm.

Cathepsin l 1b protein expression in the hatching gland. The expression of Cathepsin L 1b (Ctsl1b), which is one of hatching gland enzymes, was examined using whole-mount immunohistochemistry at 25 hpf. (a) Wild-type (klf17+/+), (b,c) klf17-deficient embryos: klf17uy21/uy22 (b) and klf17uy22/uy23. (c) Ventral view, anterior up. Arrowheads indicate the position of the hatching gland. After taking pictures, genotyping of individual embryos was performed by genomic PCR. Scale bar, 200 μm.

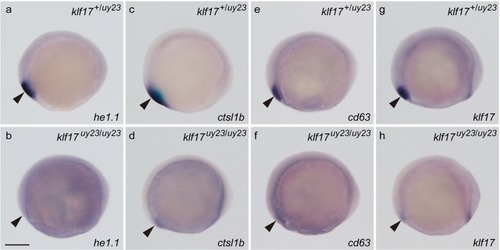
The expression of polster genes in the klf17-deficient embryos at the bud stage. The expression of polster markers he1.1 (a,b), ctsl1b (c,d), cd63 (e,f) and klf17 (g,h) was examined by WISH at the bud stage. (a,c,e,g) Wild-type embryos (klf17+/uy23). (b,d,f,h) klf17-deficient embryos (klf17uy23/uy23). Lateral view, anterior left. Arrowheads indicate the position of the polster. After taking pictures, genotyping of individual embryos was performed by genomic PCR. Scale bar, 200 μm.

EXPRESSION / LABELING:
Genes:
Fish:
Anatomical Term:
Stage: Bud
PHENOTYPE:
Fish:
Observed In:
Stage: Bud

The expression of hatching gland genes in the klf17-deficient embryos at 25 hpf. (a,c,e,g) Wild-type embryos at 25 hpf. (b,d,f,h) klf17-deficient embryos at 25 hpf. Ventral view, anterior up. Arrowheads indicate the position of the hatching gland. After taking pictures, genotyping of individual embryos was performed by genomic PCR. Scale bar, 200 μm.

Acknowledgments
This image is the copyrighted work of the attributed author or publisher, and ZFIN has permission only to display this image to its users. Additional permissions should be obtained from the applicable author or publisher of the image. Full text @ Sci. Rep.