
- Title
-
Developmental exposure to a human relevant mixture of endocrine disruptors alters metabolism and adipogenesis in zebrafish (Danio rerio)
- Authors
- Mentor, A., Brunström, B., Mattsson, A., Jönsson, M.
- Source
- Full text @ Chemosphere
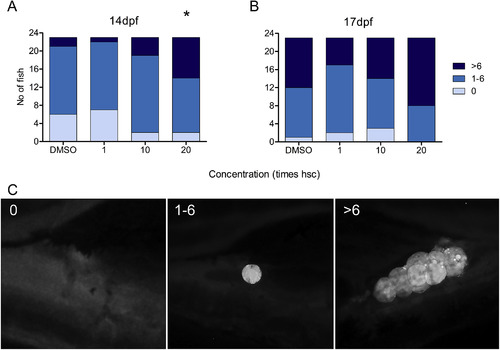
Number of adipocytes formed at A) 14 and B) 17 dpf in zebrafish after exposure to mixture G from 3 hpf. The fish were classified into groups based on the number of adipocytes observed: no (0), between 1 and 6 (1–6), and more than 6 (>6). Each exposure group was compared to the vehicle control (DMSO) using Fisher-Freeman-Halton exact test. *p < 0.05. C) Representative pictures of the visceral area in a fish with 0, 1, and >6 adipocytes respectively. |
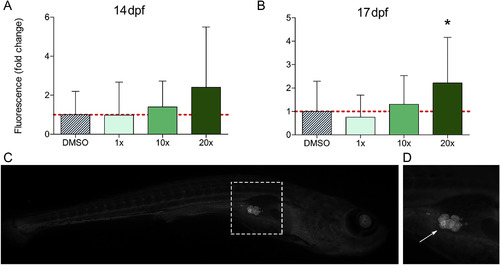
Mean fluorescence in visceral adipose tissue (VAT) in zebrafish at A) 14 dpf (n = 23) and B) 17 dpf (n = 21–22) after exposure to the vehicle (0.01% DMSO) or mixture G (1, 10, or 20x hsc) from 3 hpf. The error bars represent the standard deviation. Statistically significant differences compared with the DMSO control were determined using Kruskal Wallis test with Dunn's multiple comparison test and are indicated by * (p < 0.05). C) Fluorescence image of a whole fish. The square in C) is magnified in D); the arrow indicates lipid droplets of VAT adipocytes. |