
Image
|
Figure Caption
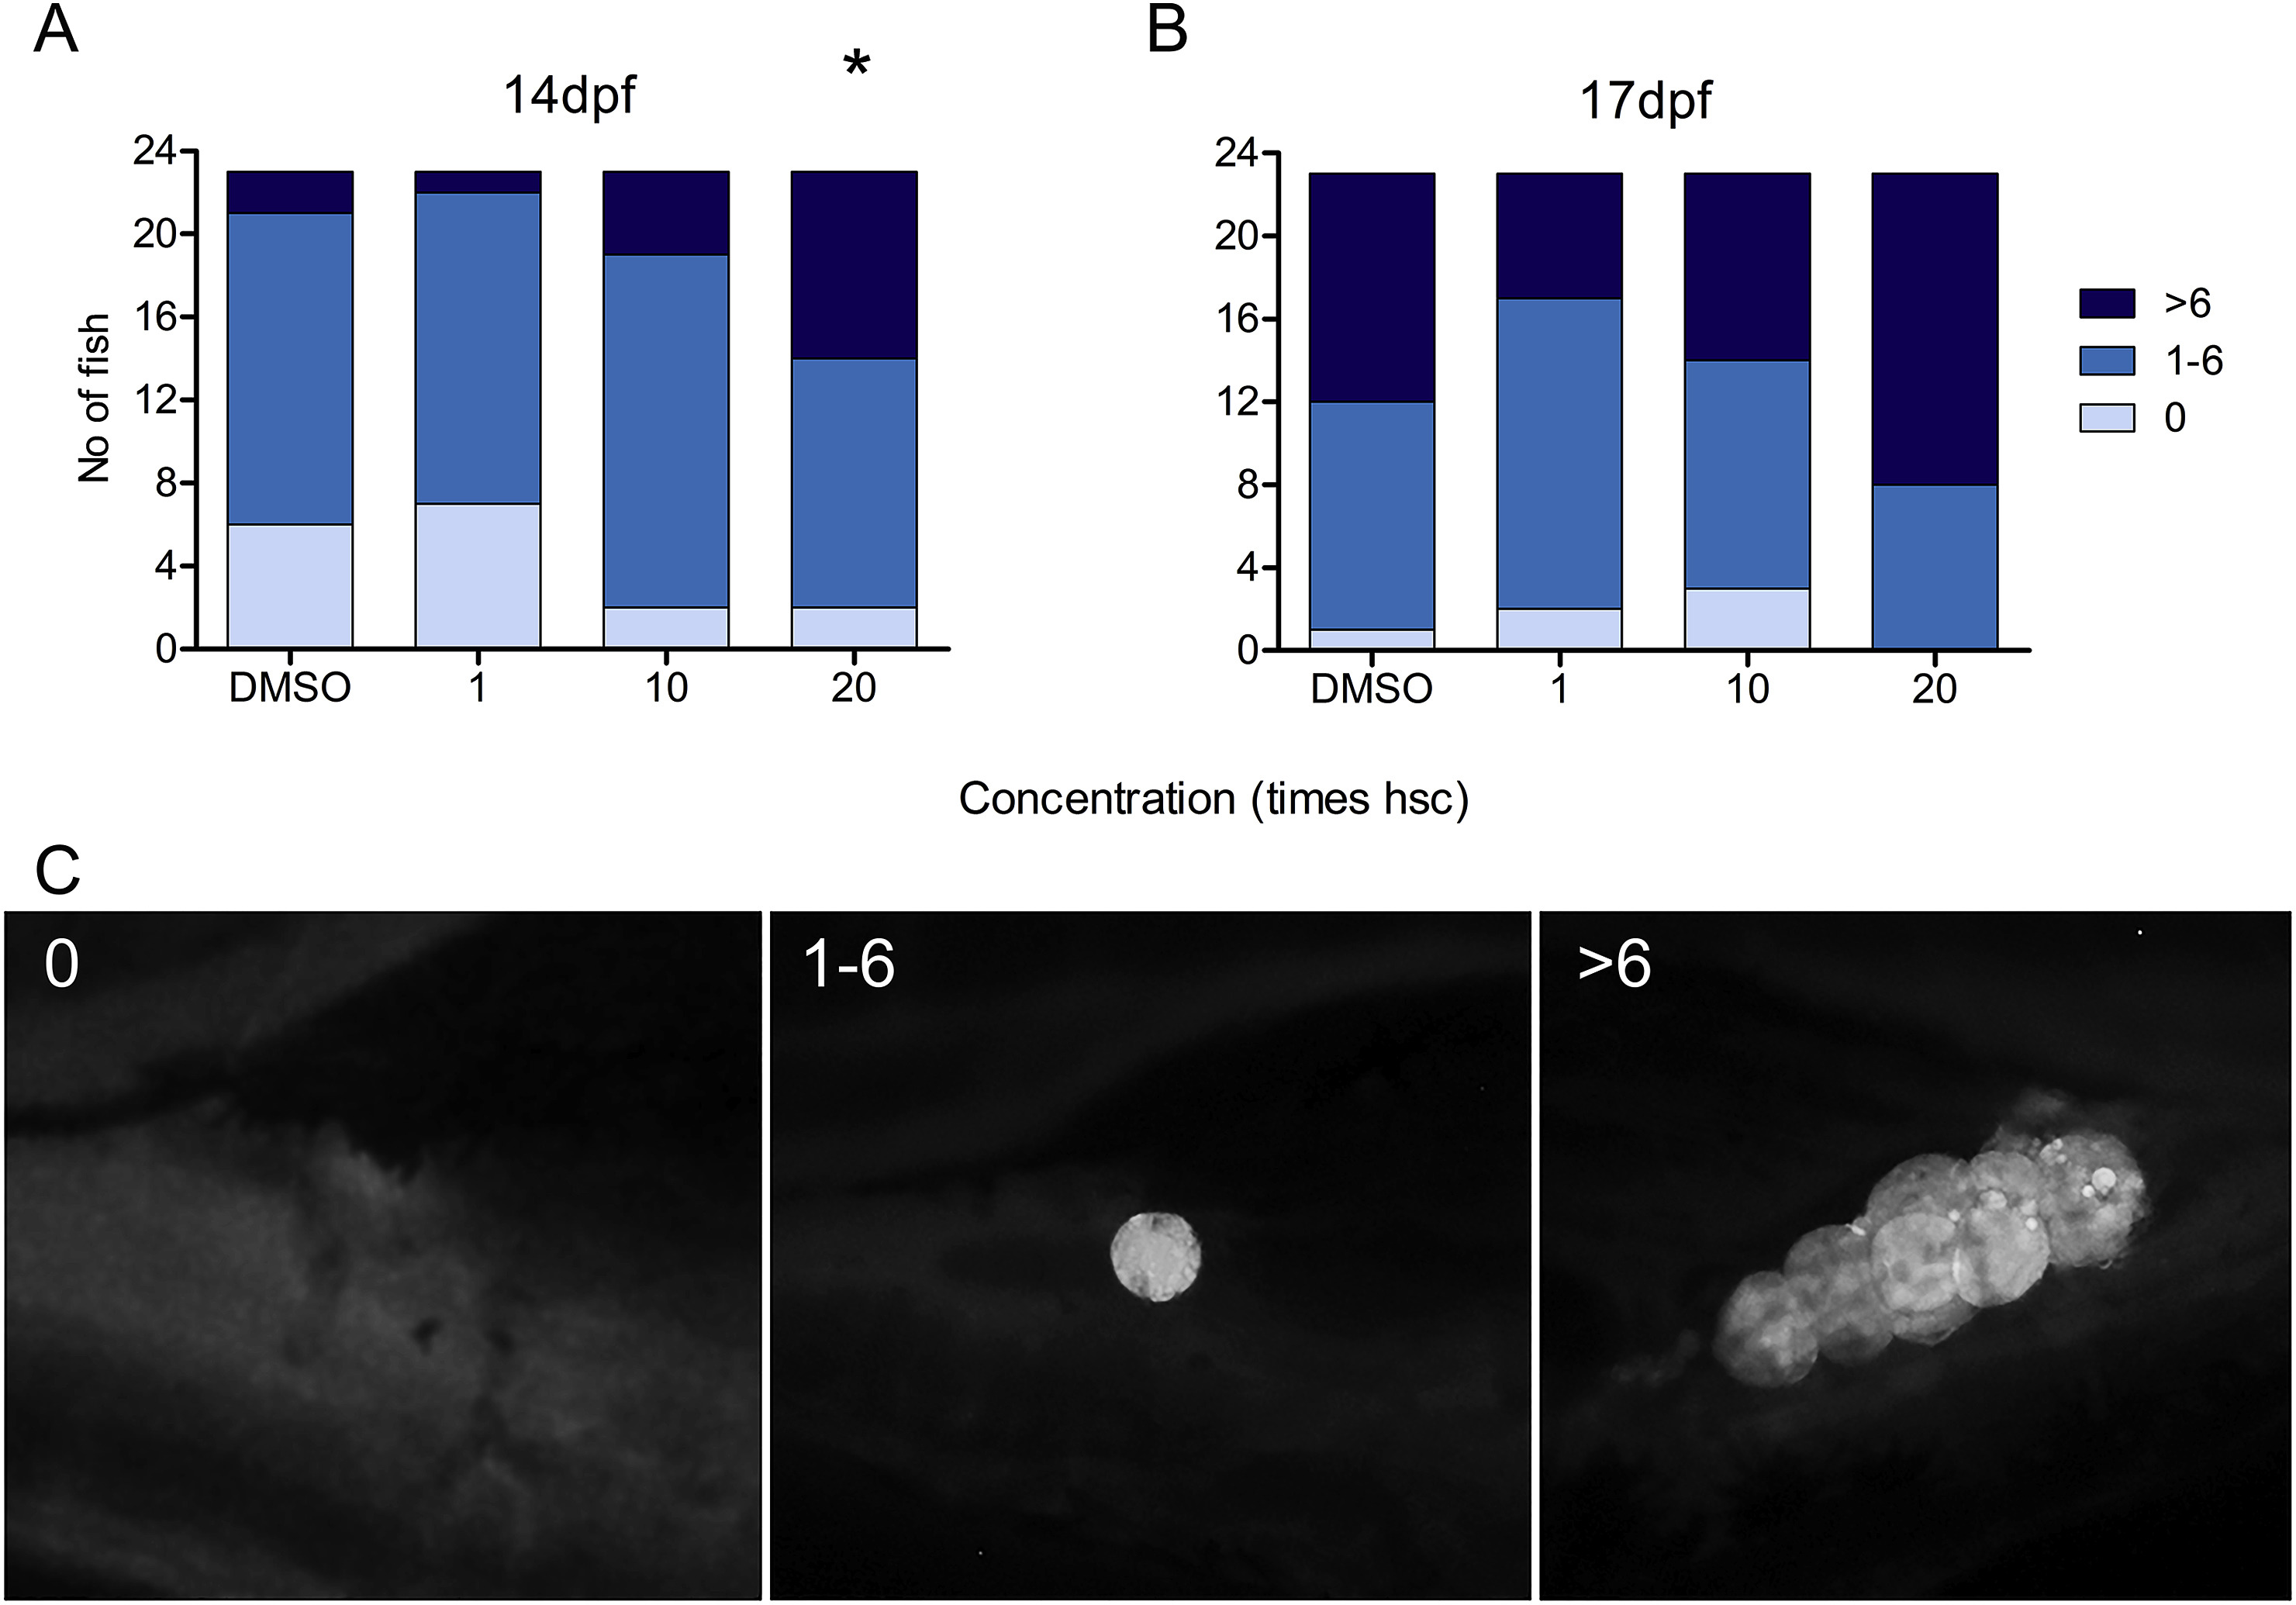
Fig. 4
Number of adipocytes formed at A) 14 and B) 17 dpf in zebrafish after exposure to mixture G from 3 hpf. The fish were classified into groups based on the number of adipocytes observed: no (0), between 1 and 6 (1–6), and more than 6 (>6). Each exposure group was compared to the vehicle control (DMSO) using Fisher-Freeman-Halton exact test. *p < 0.05. C) Representative pictures of the visceral area in a fish with 0, 1, and >6 adipocytes respectively.
Acknowledgments
This image is the copyrighted work of the attributed author or publisher, and
ZFIN has permission only to display this image to its users.
Additional permissions should be obtained from the applicable author or publisher of the image.
Full text @ Chemosphere