
FIGURE
Fig. 5
- ID
- ZDB-FIG-200207-11
- Publication
- Mentor et al., 2019 - Developmental exposure to a human relevant mixture of endocrine disruptors alters metabolism and adipogenesis in zebrafish (Danio rerio)
- Other Figures
- All Figure Page
- Back to All Figure Page
Fig. 5
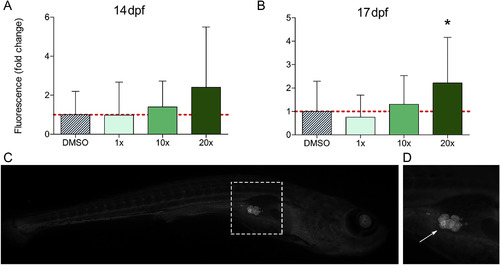
Mean fluorescence in visceral adipose tissue (VAT) in zebrafish at A) 14 dpf (n = 23) and B) 17 dpf (n = 21–22) after exposure to the vehicle (0.01% DMSO) or mixture G (1, 10, or 20x hsc) from 3 hpf. The error bars represent the standard deviation. Statistically significant differences compared with the DMSO control were determined using Kruskal Wallis test with Dunn's multiple comparison test and are indicated by * (p < 0.05). C) Fluorescence image of a whole fish. The square in C) is magnified in D); the arrow indicates lipid droplets of VAT adipocytes. |
Expression Data
Expression Detail
Antibody Labeling
Phenotype Data
Phenotype Detail
Acknowledgments
This image is the copyrighted work of the attributed author or publisher, and
ZFIN has permission only to display this image to its users.
Additional permissions should be obtained from the applicable author or publisher of the image.
Full text @ Chemosphere