
- Title
-
Ankrd45 Is a Novel Ankyrin Repeat Protein Required for Cell Proliferation
- Authors
- Kang, Y., Xie, H., Zhao, C.
- Source
- Full text @ Genes (Basel)
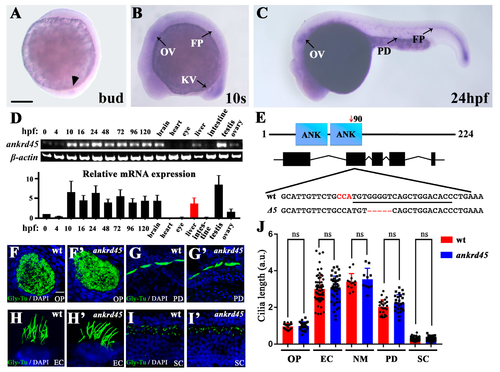
Expression pattern of ankrd45 and cilia development in ankrd45 mutants. (A–C) Whole-mount in situ hybridization results showing the expression of ankrd45 at different stages. (A) At the bud stage, ankrd45 is expressed in the dorsal forerunner cells (arrowhead). (B) At the 10-somite stage, ankrd45 is expressed in the otic vesicle (OV), Kupffer’s vesicle (KV), and floor plate (FP). (C) ankrd45 is enriched in the otic vesicle, the pronephric duct (PD), and the floor plate at 24 hpf. (D) Real-time PCR showing the expression of ankrd45 at different stages or adult tissues as indicated. Bottom: bar graph showing the relative expression levels of ankrd45 at different stages or adult tissues as indicated. (E) Diagram showing the genomic structure of the zebrafish ankrd45 gene. Bottom shows the sequences of wild-type and mutant alleles (Δ5). Underlined sequence indicates the spCas9 target region, and the PAM sequence is indicated in red. (F–I’) Confocal images showing the cilia in the olfactory pit (F,F’), pronephric duct (G,G’), ear cristae (H,H’), and spinal cord (I,I’) in wild-type or mutant larvae visualized with anti-glycylated tubulin antibody. (J) Bar graph showing the length of cilia per arbitrary unit (a.u.) in different organs as indicated. OP, olfactory pit; EC, ear cristae; SC, spinal cord; NM, neuromast. Scale bars: 200 μm in A–C; 20 μm in F–I’. ns, not significant. |
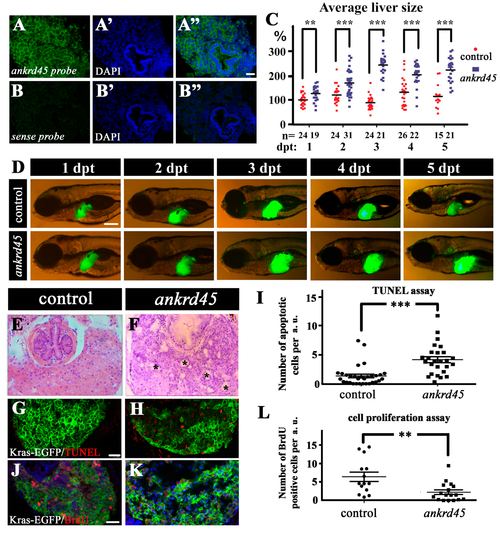
Liver-specific induction of KrasG12V results in larger livers in ankrd45 mutants. (A–B”) Fluorescent in situ hybridization results showing the expression of ankrd45 in the liver of 5 dpf wild-type zebrafish larvae. Sense probe of ankrd45 was used as a negative control (B–B”). (C) Statistical results showing the average size of livers in control larvae (EGFP-krasG12V heterozygote transgene) or ankrd45 larvae (ankrd45 homozygous mutants carrying EGFP-krasG12V heterozygote transgene) at different time points after doxycycline treatment as indicated. Each dot represents the size of one larva. The average size of the livers at 1 day post treatment (dpt) in the control larvae was set as 100%. The number of larvae examined is shown at the bottom. (D) Representative images showing EGFP-KrasG12V expression in the livers of control and ankrd45 mutants at different time points after doxycycline treatment. (E,F) Hematoxylin and eosin staining results showing the multiple cyst-like regions (asterisks) in the livers of ankrd45mutants after treatment. (G,H) Confocal images showing the apoptotic cells stained by the TUNEL assay. (I) Dotted graph showing the number of apoptotic cells in the livers of control and ankrd45 mutants 3 days after treatment. (J,K) Confocal images showing BrdU positive cells in the livers of control and mutant larvae as indicated. (L) Dotted graph showing the number of BrdU positive cells in the livers of control and ankrd45 mutants 3 days after treatment. Scale bars: 25 μm in panels A–B”, 200 μm in panel D, and 25 μm in panels G–K. ** p < 0.01, *** p < 0.001. PHENOTYPE:
|

Subcellular localization of ANKRD45 during mitosis. (A–D”) Subcellular localization of ANKRD45 during mitosis in human hepatoma Hep3B cells. The distribution of ANKRD45 was visualized with anti-ANKRD45 antibody (green). The cytoskeleton was stained by anti-α-tubulin antibody (red) and nuclei were labeled with DAPI (blue). (E) Hep3B cells were treated with control or four siRNAs against ANKRD45 and analyzed with Western blotting using ANKRD45 antibody or a cleaved form of the PARP antibody. The α-tubulin antibody was used as a loading control. Bottom bar graph shows the statistical results of ANKRD45 expression in control or siRNA-treated cells from the immunoblots results. (F,G) Confocal images showing the localization of ANKRD45 in the midbody during cytokinesis in control (F) or siRNA#2 (G) treated HeLa cells. (H) Quantitative analysis of relative ANKRD45 expression in the midbody ring of control or siRNA#2-treated HeLa cells. NC, negative control. Scale bars: 5 μm. *** p < 0.001. |

Knockdown of ANKRD45 results in cell cycle defects. (A,B) DIC (Differential Interference Contrast) still images obtained from time-lapse microscopy showing HeLa cells undergoing cell division. Compared with control siRNA-treated cells (A), knockdown of ANKRD45 (B) resulted in the delay of cell division and cell death. (C,D) Flow cytometry analysis of Annexin V-FITC and propidium iodide staining of the control and ANKRD45 siRNA-treated Hep3B cells. The percentage of apoptotic cells increased significantly after siRNA treatment (D). (E) Cell proliferation of Hep3B cells analyzed by CCK-8 assay. (F,G) Flow cytometry cell cycle analysis of Hep3B cells treated with control or siRNA. The percentage of cells in different phases of the cell cycle are shown in (G). (H) Confocal images showing proliferating and apoptotic Hep3B cells visualized by BrdU incorporation and the TUNEL assay. (I) Quantitative results of the percentage of BrdU positive cells in control or siRNA-treated Hep3B cells. (J) Quantitative results of the percentage of apoptotic cells from the TUNEL assay. NC, negative control. Scale bars: 25 μm. * p < 0.05, ** p < 0.01, *** p < 0.001. |
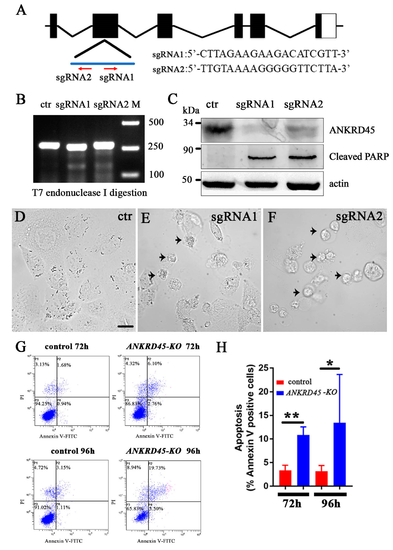
Transient knockdown of ANKRD45 with the CRISPR/Cas9 system results in cell apoptosis. (A) Genomic structure of the human ANKRD45 gene and sequences of two sgRNAs. Red arrows indicate the position and direction of the two sgRNAs. (B) Efficiency of the two sgRNAs analyzed by T7 endonuclease I digestion (T7EI). (C) Western blotting results showing the knockdown efficiency of two ANKRD45-targeting sequences. Both targets led to the reduction of ANKRD45 expression and increased the level of the cleaved PARP. (D–F) DIC images showing Hep3B cells transfected with control or ANKRD45 targeting constructs containing different sgRNAs as indicated. Arrowheads represent the apoptotic cells. (G) Flow cytometry analysis of Annexin V-FITC and propidium iodide staining of Hep3B cells transfected with sgRNA or empty vectors. (H) Bar graph showing the percentages of Annexin V positive cells at 72 h and 96 h after transfection with control or sgRNAs as indicated. * p < 0.05, ** p < 0.01, Scale bar: 25 μm. |

Identification of ankrd45 mutants (A) Sequences of partial ankrd45 cDNA from wild type and mutant (D5) alleles. Red box indicates the 5bp sequence that was absent in the mutant allele. Bottom shows the predicted proteins encoded by mutant and wild type ankrd45 alleles. (B) Sample electrophoresis images showing the genotype results of wild type, heterozygous and homozygous zebrafish larvae. (C-D) Whole in situ hybridization results of ankrd45 expression in wild type (C) and ankrd45 homozygous mutants (D). The number of embryos examined was shown in the bottom. Scale bar: 100 μm. |
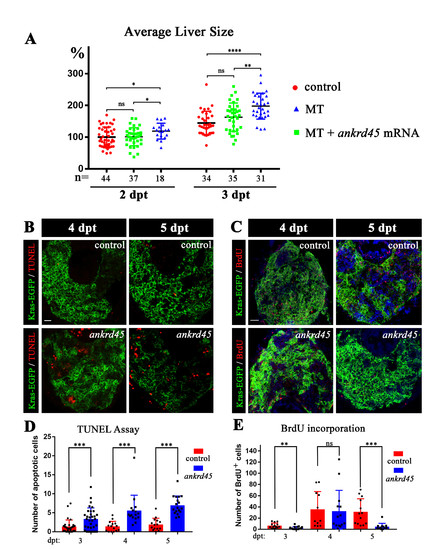
. Liver-specific induction of KrasG12V in ankrd45 mutant (A) Dotted graph showing the average size of liver in different groups as indicated. Ectopic expression of Ankrd45 inhibited the overgrowth of liver in the homozygous mutants (MT). The number of embryos examined was shown in the bottom. (B) Confocal images showing the apoptotic cells stained by TUNEL assay at 4 and 5 days after treatment. (C) Confocal images showing proliferating cells visualized by BrdU incorporation assay. (D) Statistical results of apoptotic cells at different time point after doxycycline treatment in the liver of control and ankrd45 larvae. (E) Statistical results showing the number of BrdU positive cells at different time point after doxycycline treatment. Scale bars, 25 μm. |

Localization of ANKRD45 in different cell lines (A-D) Confocal images showing the localization of ANKRD45 in the midbody ring during cytokinesis of different cells as indicated. (E-F) Pre-incubation with synthesized ANKRD45 protein blocked the staining of ANKRD45 antibody in the midbody ring of U2OS cells. (G) Western blotting results showing the expression of ANKRD45 and cleaved PARP in control or four ANKRD45 siRNAs treated HeLa Cells. (H) Bar graph showing the relative expression level of ANKRD45 in control or siRNA treated HeLa cells. Scale bar: 5 μm. |