
- Title
-
Znf76 is associated with development of the eyes, midbrain, MHB, and hindbrain in zebrafish embryos
- Authors
- Jung, J., Udhaya Kumar, S., Choi, I., Huh, T.L., Rhee, M.
- Source
- Full text @ Animal Cells Syst (Seoul)
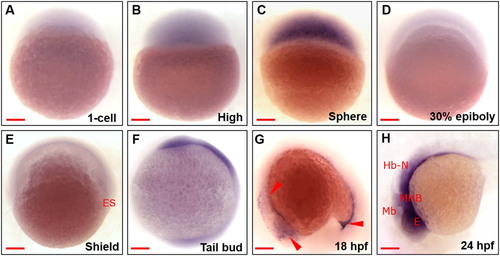
Spatiotemporal expression of zebrafish znf76 during embryonic development WISH experiments performed with a znf76 antisense RNA probe at the 1-cell (A), high (B), sphere (C), 30% epiboly (D), shield (E), tail bud (F), 18 hpf (G), and 24 hpf (H) stages. All the images are from the lateral view (A–H). znf76transcripts were zygotically expressed in the early stages and were reduced in the 30% epiboly and shield stages (D,E). znf76 transcripts were present in the head and tail region (red arrowheads) at the tail bud stage (F) and then became progressively restricted to the trigeminal placode and proctodeum posterior gut, with a significant reduction in expression by the late somite stage (18 hpf) (G). At 24 hpf (H), znf76 transcripts were restricted to Mb, MHB, and Hb-N. Red arrowheads show the anatomical structures. Mb – midbrain, MHB – midbrain–hindbrain boundary, Hb-N – hindbrain neurons, E – eye, ES – Embryonic shield. Scale bar: 100 µm |

Effects of ectopic expression of znf76 mRNA in zebrafish embryos Lateral view of the embryos (A–C) and magnified lateral view of the embryos (D–F) at 24 hpf. (A,D) WT zebrafish embryo injected with phenol red dye in distilled water, (B,E) zebrafish embryo injected with 50 pg of znf76 mRNA, and (C,F) zebrafish embryo injected with 100 pg of znf76 mRNA. Microinjection of 50 or 100 pg of znf76 mRNA was performed at the 1-cell stage to induce overexpression. Red arrowheads indicate the specific tissues altered at 24 hpf by 50 or 100 pg of znf76 mRNA injection, compared with the WT; red dotted circles indicate the size of the eyes. NT – neural tube, SC – spinal cord, Hb – hindbrain, Mb – midbrain, E – eye, TB – tail bud, NT – neural tube. Scale bars 100 μm. |
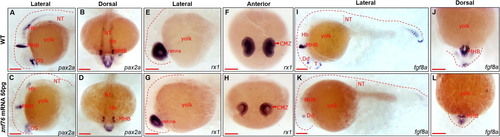
Marker analysis in znf76-overexpressing embryos WISH was performed at 24 hpf in znf76-overexpressing embryos with pax2a, rx1, and fgf8a to investigate the morphological defects at a molecular level. Lateral view (A, C, E, G, I, and K); anterior view (B, D, F, H, J, and L). pax2a transcripts were significantly reduced in the optic stalk, MHB, and hindbrain neurons compared with the WT (A-D). rx1 marks neural cells in the retina of WT embryos at 24 hpf (E,F). rx1transcripts were reduced in znf76-overexpressing embryos in the retina, especially in the CMZ area of the eyes (F,H); the size of the eyes was also reduced compared with the WT (E,G). fgf8a is a marker for the dorsal diencephalon, MHB, posterior somites, and posterior notochord. At 24 hpf, there was a marked reduction in fgf8a transcripts in these regions in znf76-overexpressing embryos (K,L) compared with the WT (I,J). CMZ – central marginal zone, Dd – dorsal diencephalon, MHB – midbrain–hindbrain boundary, Hb – hindbrain, T – telencephalon, NT – neural tube, OS – optic stalk. Scale bar: 100 µm. |

Znf76 is associated with development of the eyes, midbrain, MHB, and hindbrain in zebrafish embryos |