
- Title
-
Psoralen Induces Developmental Toxicity in Zebrafish Embryos/Larvae Through Oxidative Stress, Apoptosis, and Energy Metabolism Disorder
- Authors
- Xia, Q., Wei, L., Zhang, Y., Kong, H., Shi, Y., Wang, X., Chen, X., Han, L., Liu, K.
- Source
- Full text @ Front Pharmacol

The phenotypic changes of embryos at 24, 48, 72, and 96 hpf. SBD, swim bladder deficiency; YR, yolk retention; PE, pericardial edema; CBS, curved body shape. |
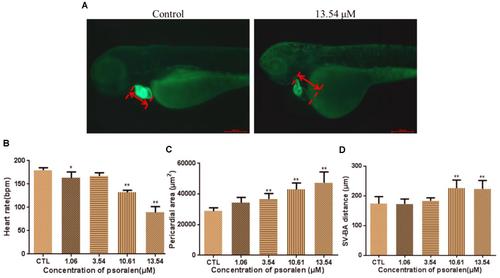
Effects of psoralen on developing heart. (A)Phenotypes of larvae of Tg(cmlc2:EGFP) lines. SV–BA distance is indicated by red row. (B) Heart rates at 72 hpf. (C) Pericardial area at 72 hpf. (D) SV–BA distance at 72 hpf. The values are expressed as mean ± SD (n = 3). ∗Represents p-value less than 0.05 and ∗∗represents p-value less than 0.01. |

Effects of psoralen on developing liver. (A)Phenotypes of larvae of Tg(L-FABP:EGFP) lines. (B)Liver area at 96 hpf. (C) Liver intensity at 96 hpf. The values are expressed as mean ± SD (n = 3). ∗Represents p-value less than 0.05 and ∗∗represents p-value less than 0.01.
|
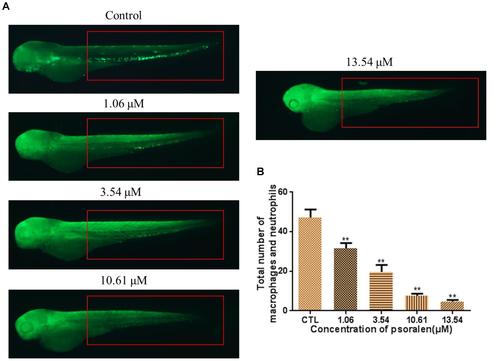
Effects of psoralen on the macrophage and neutrophil. (A) Phenotypes of larvae of Tg(Lyz:EGFP)lines. The total number of macrophage and neutrophil was counted in red box regions. (B) Total number of macrophage and neutrophil in larva at 72 hpf. The values are expressed as mean ± SD (n = 3). ∗Represents p-value less than 0.05 and ∗∗represents p-value less than 0.01. |
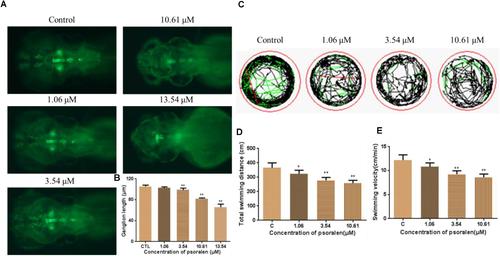
Effects of psoralen on the developing nervous system. (A) Dopamine ganglion at 96 hpf. (B) The length of dopamine ganglion. (C) Motion track of larva at 7 dpf, red lines indicate high speed, green lines indicate middle speed, black lines indicate slow speed. (D) Total swimming distance. (E) Swimming velocity. The values are expressed as mean ± SD (n= 3). ∗Represents p-value less than 0.05 and ∗∗represents p-value less than 0.01. |

Effects of psoralen on the ROS generation and apoptosis. (A) Fluorescence micrographs of ROS generation in zebrafish larvae at 96 hpf. (B) Quantitative analysis of ROS generation. (C) Fluorescence micrographs of apoptotic cells in zebrafish larvae at 96 hpf (White arrows indicate apoptotic cells in nervous system). (D) Quantitative analysis of apoptotic cells. The values are expressed as mean ± SD (n = 3). ∗Represents p-value less than 0.05 and ∗∗represents p-value less than 0.01. |