
Image
|
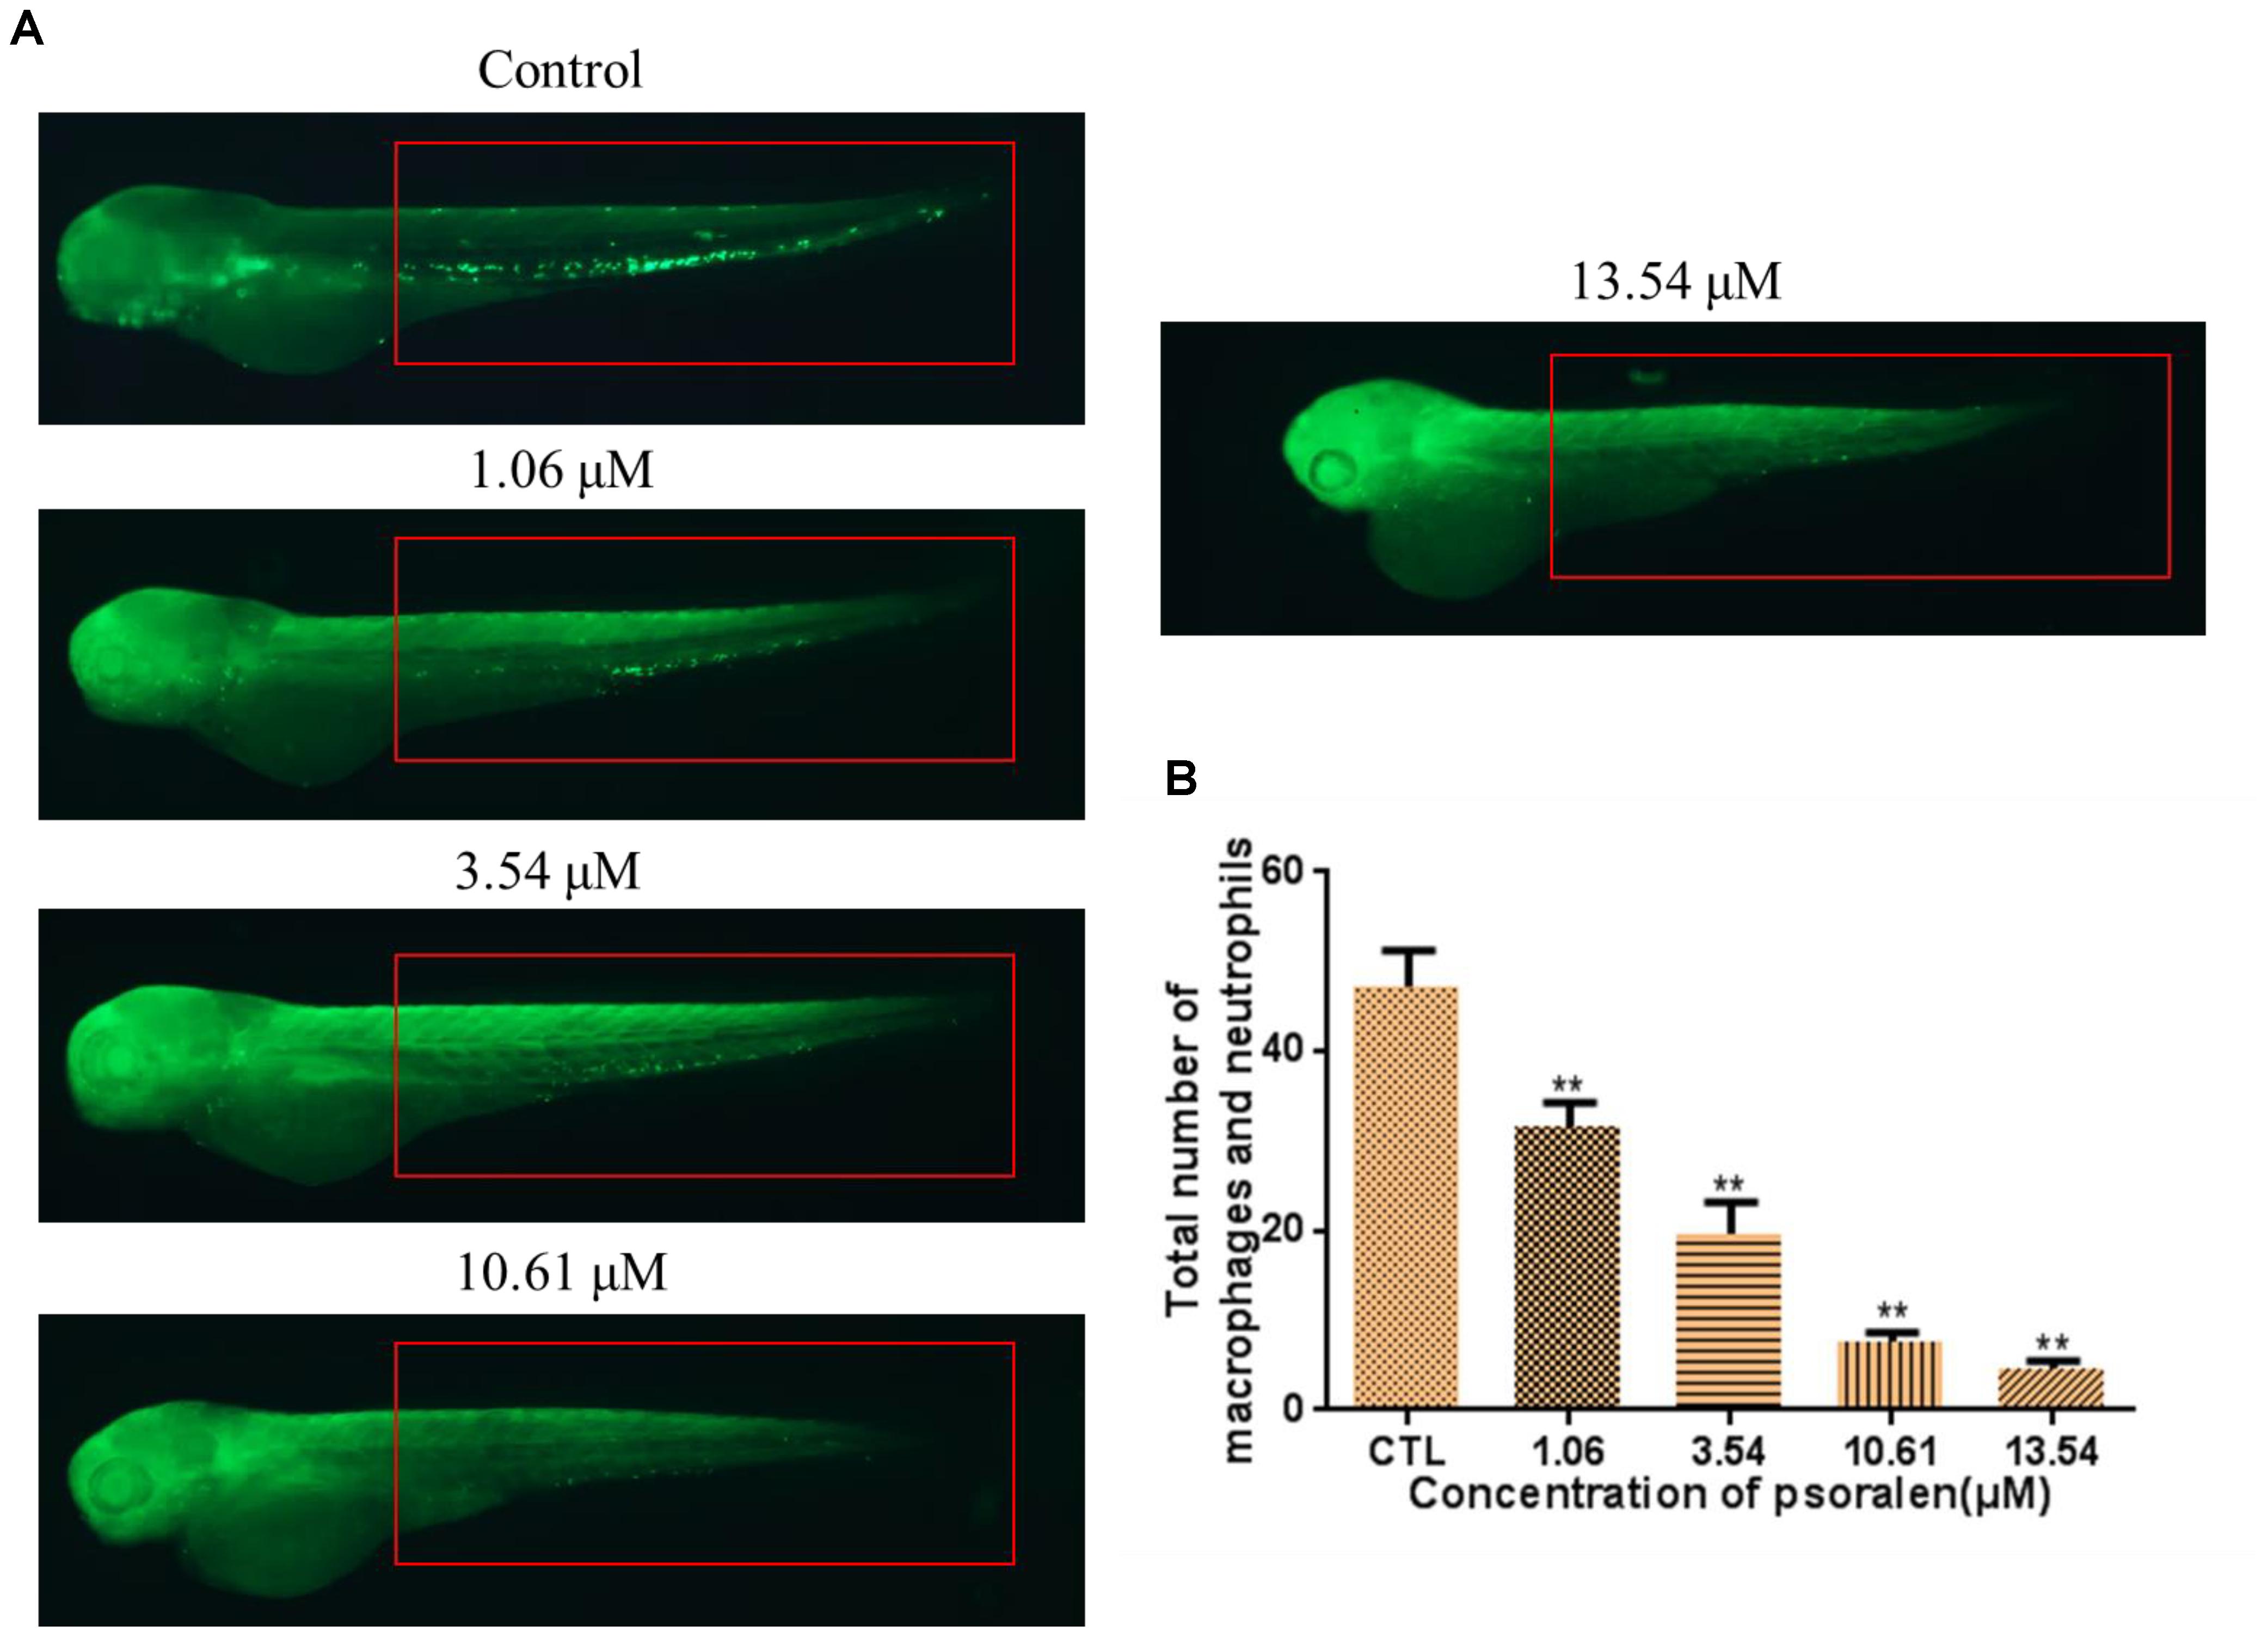
Figure Caption
Fig. 7
Effects of psoralen on the ROS generation and apoptosis. (A) Fluorescence micrographs of ROS generation in zebrafish larvae at 96 hpf. (B) Quantitative analysis of ROS generation. (C) Fluorescence micrographs of apoptotic cells in zebrafish larvae at 96 hpf (White arrows indicate apoptotic cells in nervous system). (D) Quantitative analysis of apoptotic cells. The values are expressed as mean ± SD (n = 3). ∗Represents p-value less than 0.05 and ∗∗represents p-value less than 0.01.
Acknowledgments
This image is the copyrighted work of the attributed author or publisher, and
ZFIN has permission only to display this image to its users.
Additional permissions should be obtained from the applicable author or publisher of the image.
Full text @ Front Pharmacol