
Image
|
Figure Caption
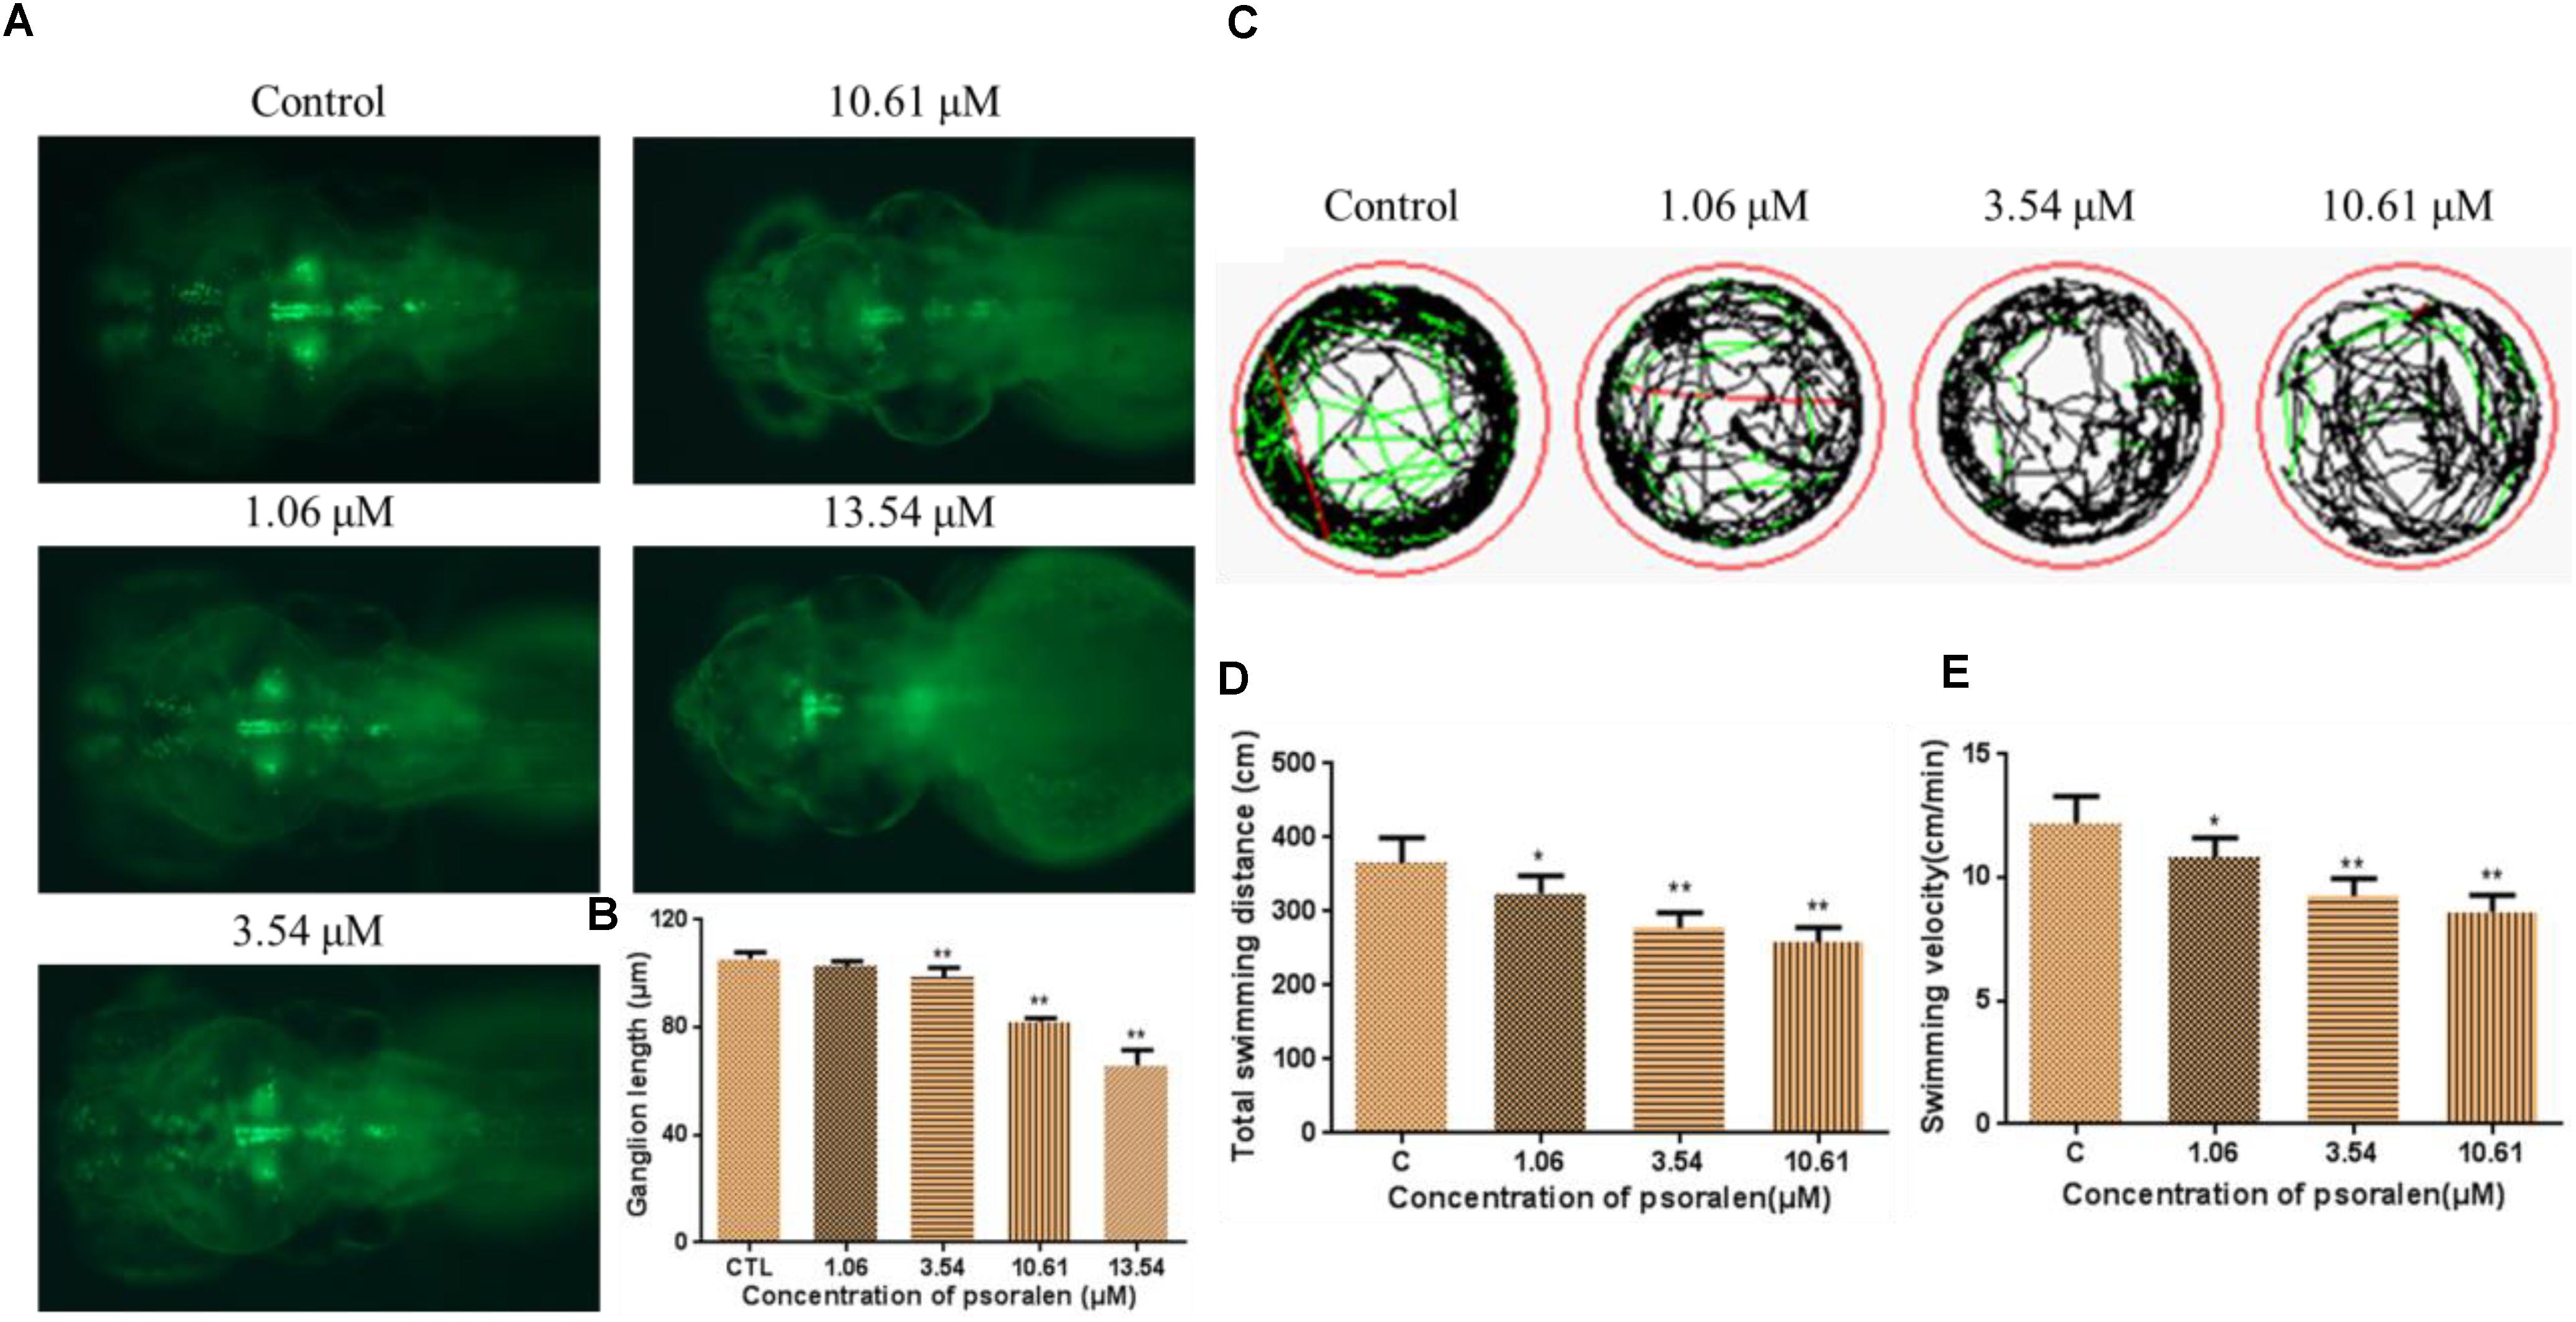
Fig. 6
Effects of psoralen on the developing nervous system. (A) Dopamine ganglion at 96 hpf. (B) The length of dopamine ganglion. (C) Motion track of larva at 7 dpf, red lines indicate high speed, green lines indicate middle speed, black lines indicate slow speed. (D) Total swimming distance. (E) Swimming velocity. The values are expressed as mean ± SD (n= 3). ∗Represents p-value less than 0.05 and ∗∗represents p-value less than 0.01.
Acknowledgments
This image is the copyrighted work of the attributed author or publisher, and
ZFIN has permission only to display this image to its users.
Additional permissions should be obtained from the applicable author or publisher of the image.
Full text @ Front Pharmacol