
- Title
-
Multi-purpose SLM-light-sheet microscope
- Authors
- Garbellotto, C., Taylor, J.M.
- Source
- Full text @ Biomed. Opt. Express
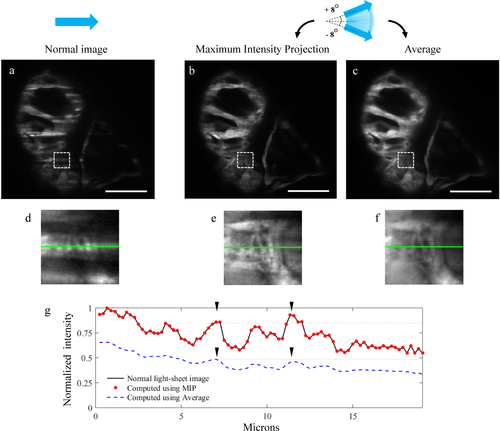
Shadow suppression using the light-sheet pivoting technique. (a) Image of a formalin-preserved Zebrafish embryo heart (4 dpf) acquired with a normal light-sheet, using setup 3. (b) Image obtained by computing the Maximum Intensity Projection (MIP) of a stack of seventeen images, acquired with the light-sheet propagating at different angles, equally spaced within ±8 degrees. (c) Image obtained by averaging the same seventeen images used for (b). (d–f) Zoomed-in views of the dashed line boxes in images (a–c). Each of these images has been normalized to its own maximum value. (g) Intensity profile of the same horizontal line in images (d–f). In order to obtain a reliable ground truth for comparison, in this specific case we selected a horizontal line that was already well-illuminated (not affected by shadows) in the normal light-sheet image (d), to which the profiles taken from (e) and (f) could be compared. This plot shows how the MIP allows to preserve the original image contrast and, with respect to averaging, a more accurate representation of the true intensity profile: notice how averaging (blue dashed line) distorts the relative intensity of the two peaks indicated by the black arrowheads, making the left peak appear as brighter than the one on the right. Intensity values in these plots are normalized to the global maximum of the three plotted lines. Scale bars: 50 µm. |
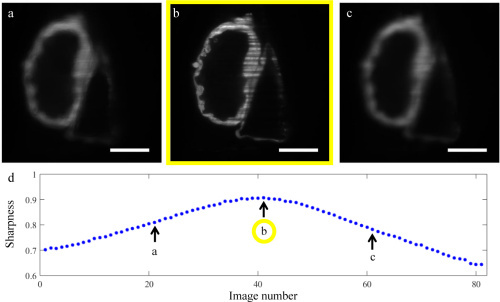
Autofocusing experiment using sharpness metric of Equation 5 on an ex-vivo 4 dpf Zebrafish embryo’s heart (using setup 1). In this illustration, eighty-one images of the same plane inside the sample were taken using the SLM to move the sheet to different positions with respect to the imaging objective, and the motorized stage to move the sample with the light-sheet (with steps of 0.5 µm, for a total range of 40 µm). (a) and (c) show images taken with the light-sheet in an out-of-focus plane, while (b) is the image identified as the one with best focus according to the sharpness metric (i.e. light-sheet at the correct distance from the imaging objective). (d) Sharpness values, one for each image, with highest value indicating the plane of best focus. Note that in practice a smaller number of images would be taken, and the sharpness interpolated using an appropriate function, to quickly find the optimum focus. Scale bars: 50 µm. |