
|
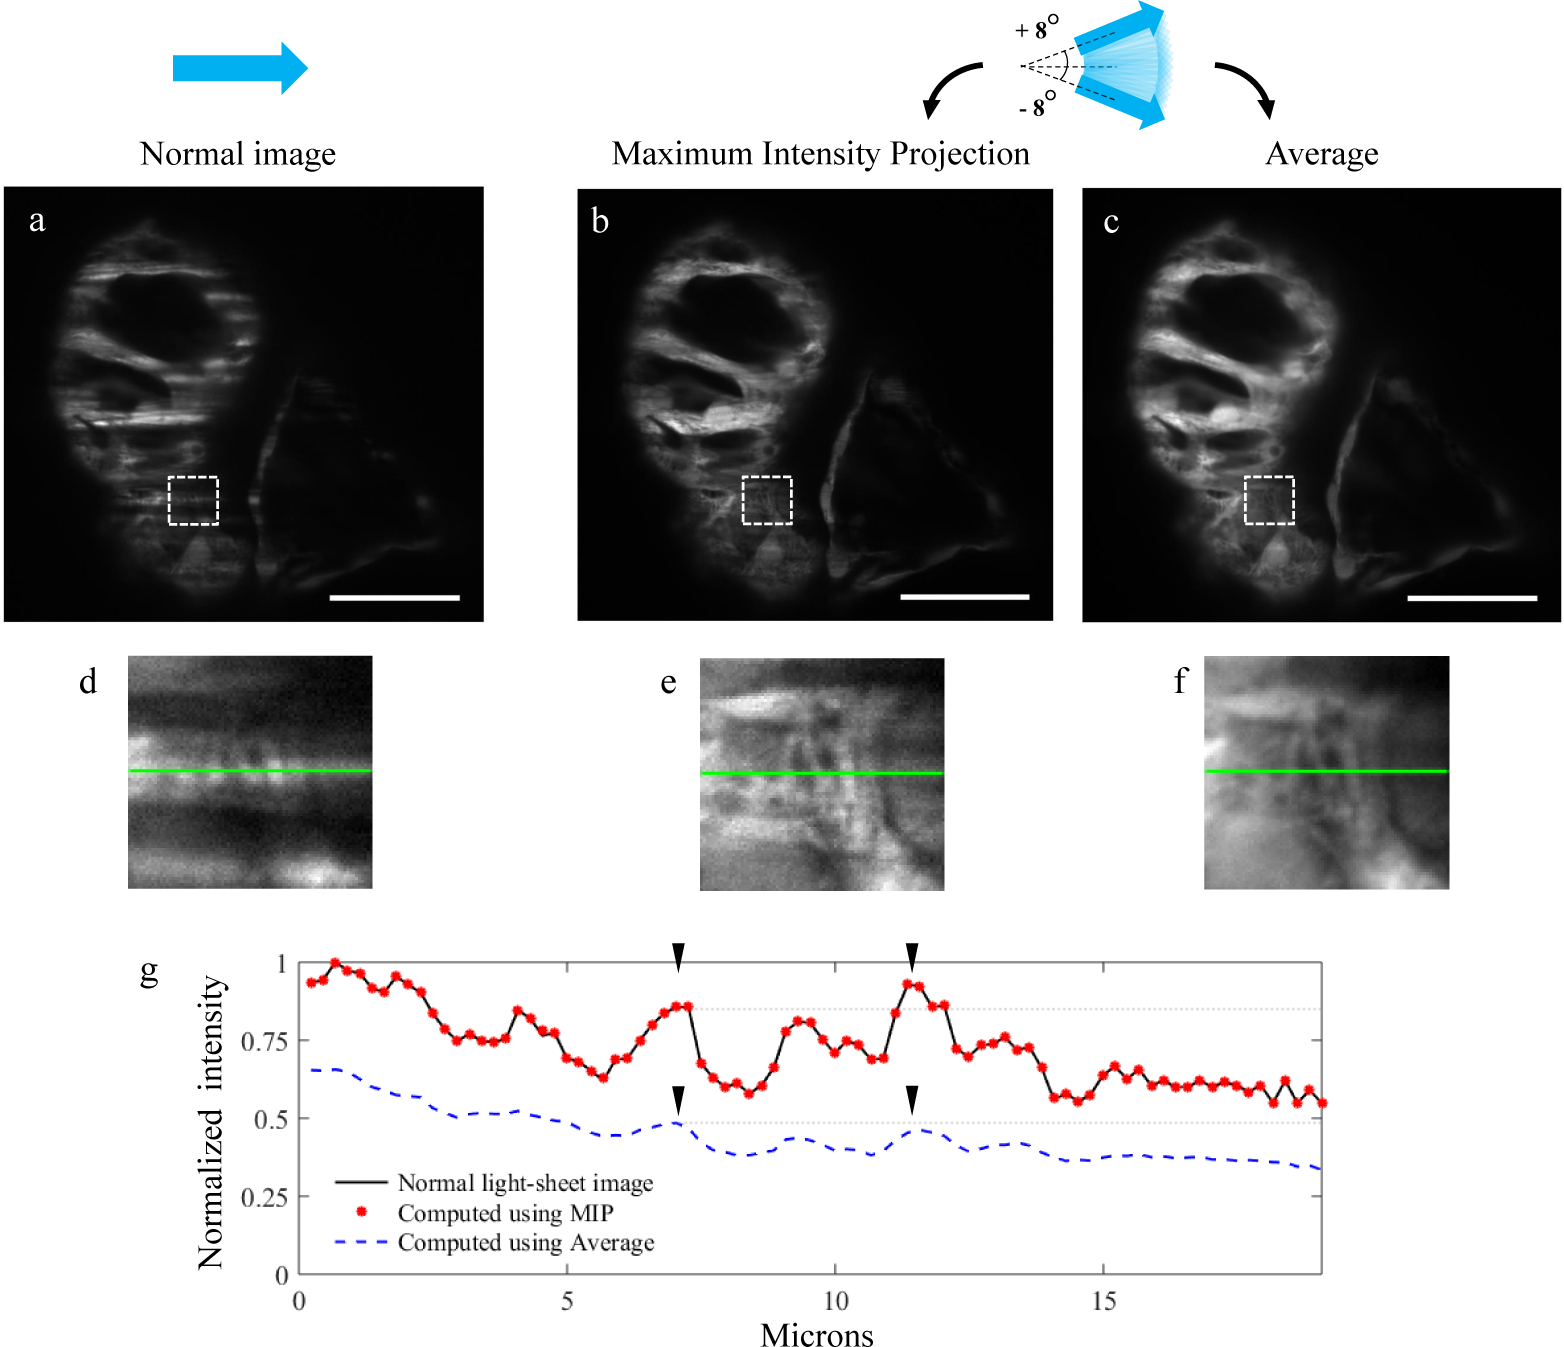
Fig. 5 Shadow suppression using the light-sheet pivoting technique. (a) Image of a formalin-preserved Zebrafish embryo heart (4 dpf) acquired with a normal light-sheet, using setup 3. (b) Image obtained by computing the Maximum Intensity Projection (MIP) of a stack of seventeen images, acquired with the light-sheet propagating at different angles, equally spaced within ±8 degrees. (c) Image obtained by averaging the same seventeen images used for (b). (d–f) Zoomed-in views of the dashed line boxes in images (a–c). Each of these images has been normalized to its own maximum value. (g) Intensity profile of the same horizontal line in images (d–f). In order to obtain a reliable ground truth for comparison, in this specific case we selected a horizontal line that was already well-illuminated (not affected by shadows) in the normal light-sheet image (d), to which the profiles taken from (e) and (f) could be compared. This plot shows how the MIP allows to preserve the original image contrast and, with respect to averaging, a more accurate representation of the true intensity profile: notice how averaging (blue dashed line) distorts the relative intensity of the two peaks indicated by the black arrowheads, making the left peak appear as brighter than the one on the right. Intensity values in these plots are normalized to the global maximum of the three plotted lines. Scale bars: 50 µm.