
|
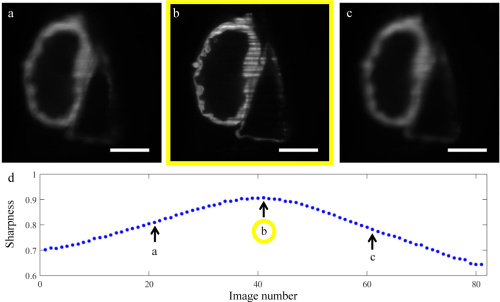
Fig. 7 Autofocusing experiment using sharpness metric of Equation 5 on an ex-vivo 4 dpf Zebrafish embryo’s heart (using setup 1). In this illustration, eighty-one images of the same plane inside the sample were taken using the SLM to move the sheet to different positions with respect to the imaging objective, and the motorized stage to move the sample with the light-sheet (with steps of 0.5 µm, for a total range of 40 µm). (a) and (c) show images taken with the light-sheet in an out-of-focus plane, while (b) is the image identified as the one with best focus according to the sharpness metric (i.e. light-sheet at the correct distance from the imaging objective). (d) Sharpness values, one for each image, with highest value indicating the plane of best focus. Note that in practice a smaller number of images would be taken, and the sharpness interpolated using an appropriate function, to quickly find the optimum focus. Scale bars: 50 µm.