
- Title
-
Optic tectal superficial interneurons detect motion in larval zebrafish
- Authors
- Yin, C., Li, X., Du, J.
- Source
- Full text @ Protein Cell
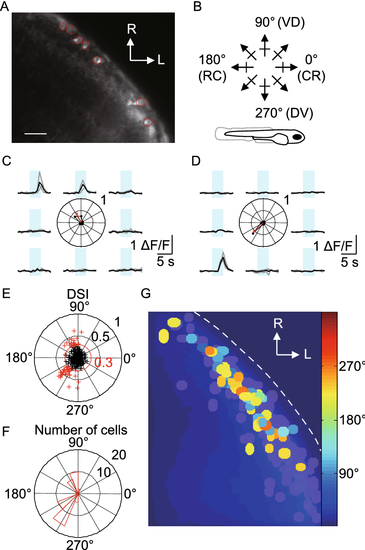
Direction selectivity of SINs. (A) Fluorescent signal in Gal4s1156t, UAS:GCaMP-HS larva. Region of interests (ROIs) are demarcated by red lines. (B) Schematic showing direction of motion of bars relative to fish body axis (Bottom). VD: ventral to dorsal. DV: dorsal to ventral. (C and D) Ca2+ transients from two somata. Center: polar plot of normalized peak amplitudes of Ca2+ transients. Arrow shows vector sum of normalized peak amplitudes, indicating PD and DSI. (E) DSI and PD for all somata. Red circle marks a DSI of 0.3, used as criterion for DS. (F) Histogram of PDs for all DS cells from (E) in red. (G) All responsive somata from grouped experiments, color-coded according to PD. Gray somata showing responsive but not DS cells (total number of cells imaged: 304; responsive cells: 247, 81.3%). Scale bar, 20 μm |
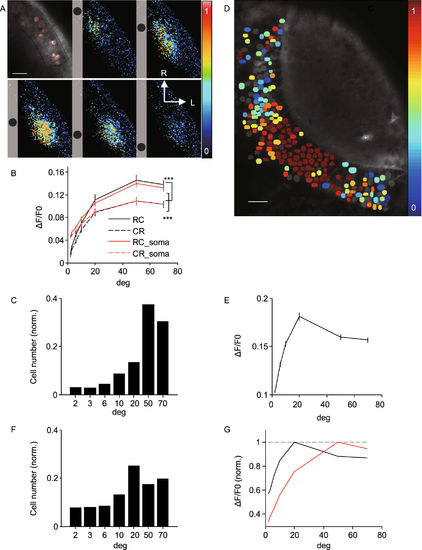
Size tuning of SINs. (A) Montage showing responses of SINs to moving dot stimulus of 10°, color-coded according to normalized responses. Relative position in each panel indicates direction of motion. Top left, fluorescence image showing analyzed ROIs demarcated by lines (population in black; somata in red). (B) Summary of responses to moving dots from population (n = 47 fishes, P = 2.3 × 10⁻¹⁰, two-way ANOVA) and responsive somata (n = 254/338, P = 1.8 × 10⁻⁹, two-way ANOVA). (C) Size preference distribution for all somata (n = 254/338 cells from 47 fishes). (D) Responses of PVNs to moving dot stimulus of 20°, color-coded according to normalized responses. Gray somata showing nonresponsive cells. (E) Summary of responses to moving dots from all somata (n = 1,651). (F) Size preference distribution from all somata. (G) Comparison of tuning curves between SINs (red) and PVNs (black) |
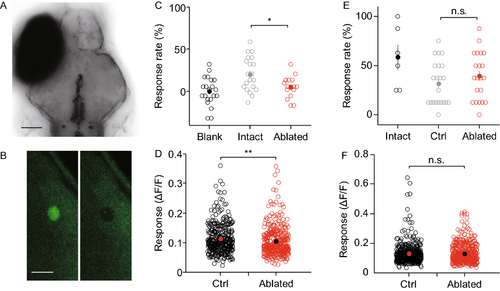
SINs are crucial for prey capture but not looming-evoked escape. (A) Confocal image of a 7 dpf larva with ipsilateral eye removed. Scale bar, 100 μm. (B) SIN before (Left panel) and after (Right panel) laser ablation. Soma is destroyed and cell debris is visible. Scale bar, 10 μm. (C) Prey capture reduced in SIN ablated larvae (n = 16) relative to control (n = 20, P = 0.0134, Student’s t-test). Blank indicates no fish control. (D) Prey-like moving dot stimulation (3°) evoked response in PVNs reduced in SIN ablated larvae (n = 348 from 13 larvae) relative to control (n = 362 from 15 larvae, P = 0.0011, Wilcoxon rank-sum test). (E) Looming evoked escape unaffected in SIN ablated larvae (n = 21) relative to control (n = 22, P = 0.3132, Wilcoxon rank-sum test). Intact fish serve as control. (F) Looming evoked tectal responses unaffected in SIN ablated larvae (n = 392 from 6 larvae) relative to control (n = 414 from 7 larvae, P = 0.9004, Wilcoxon rank-sum test) |