
|
Fig. 3
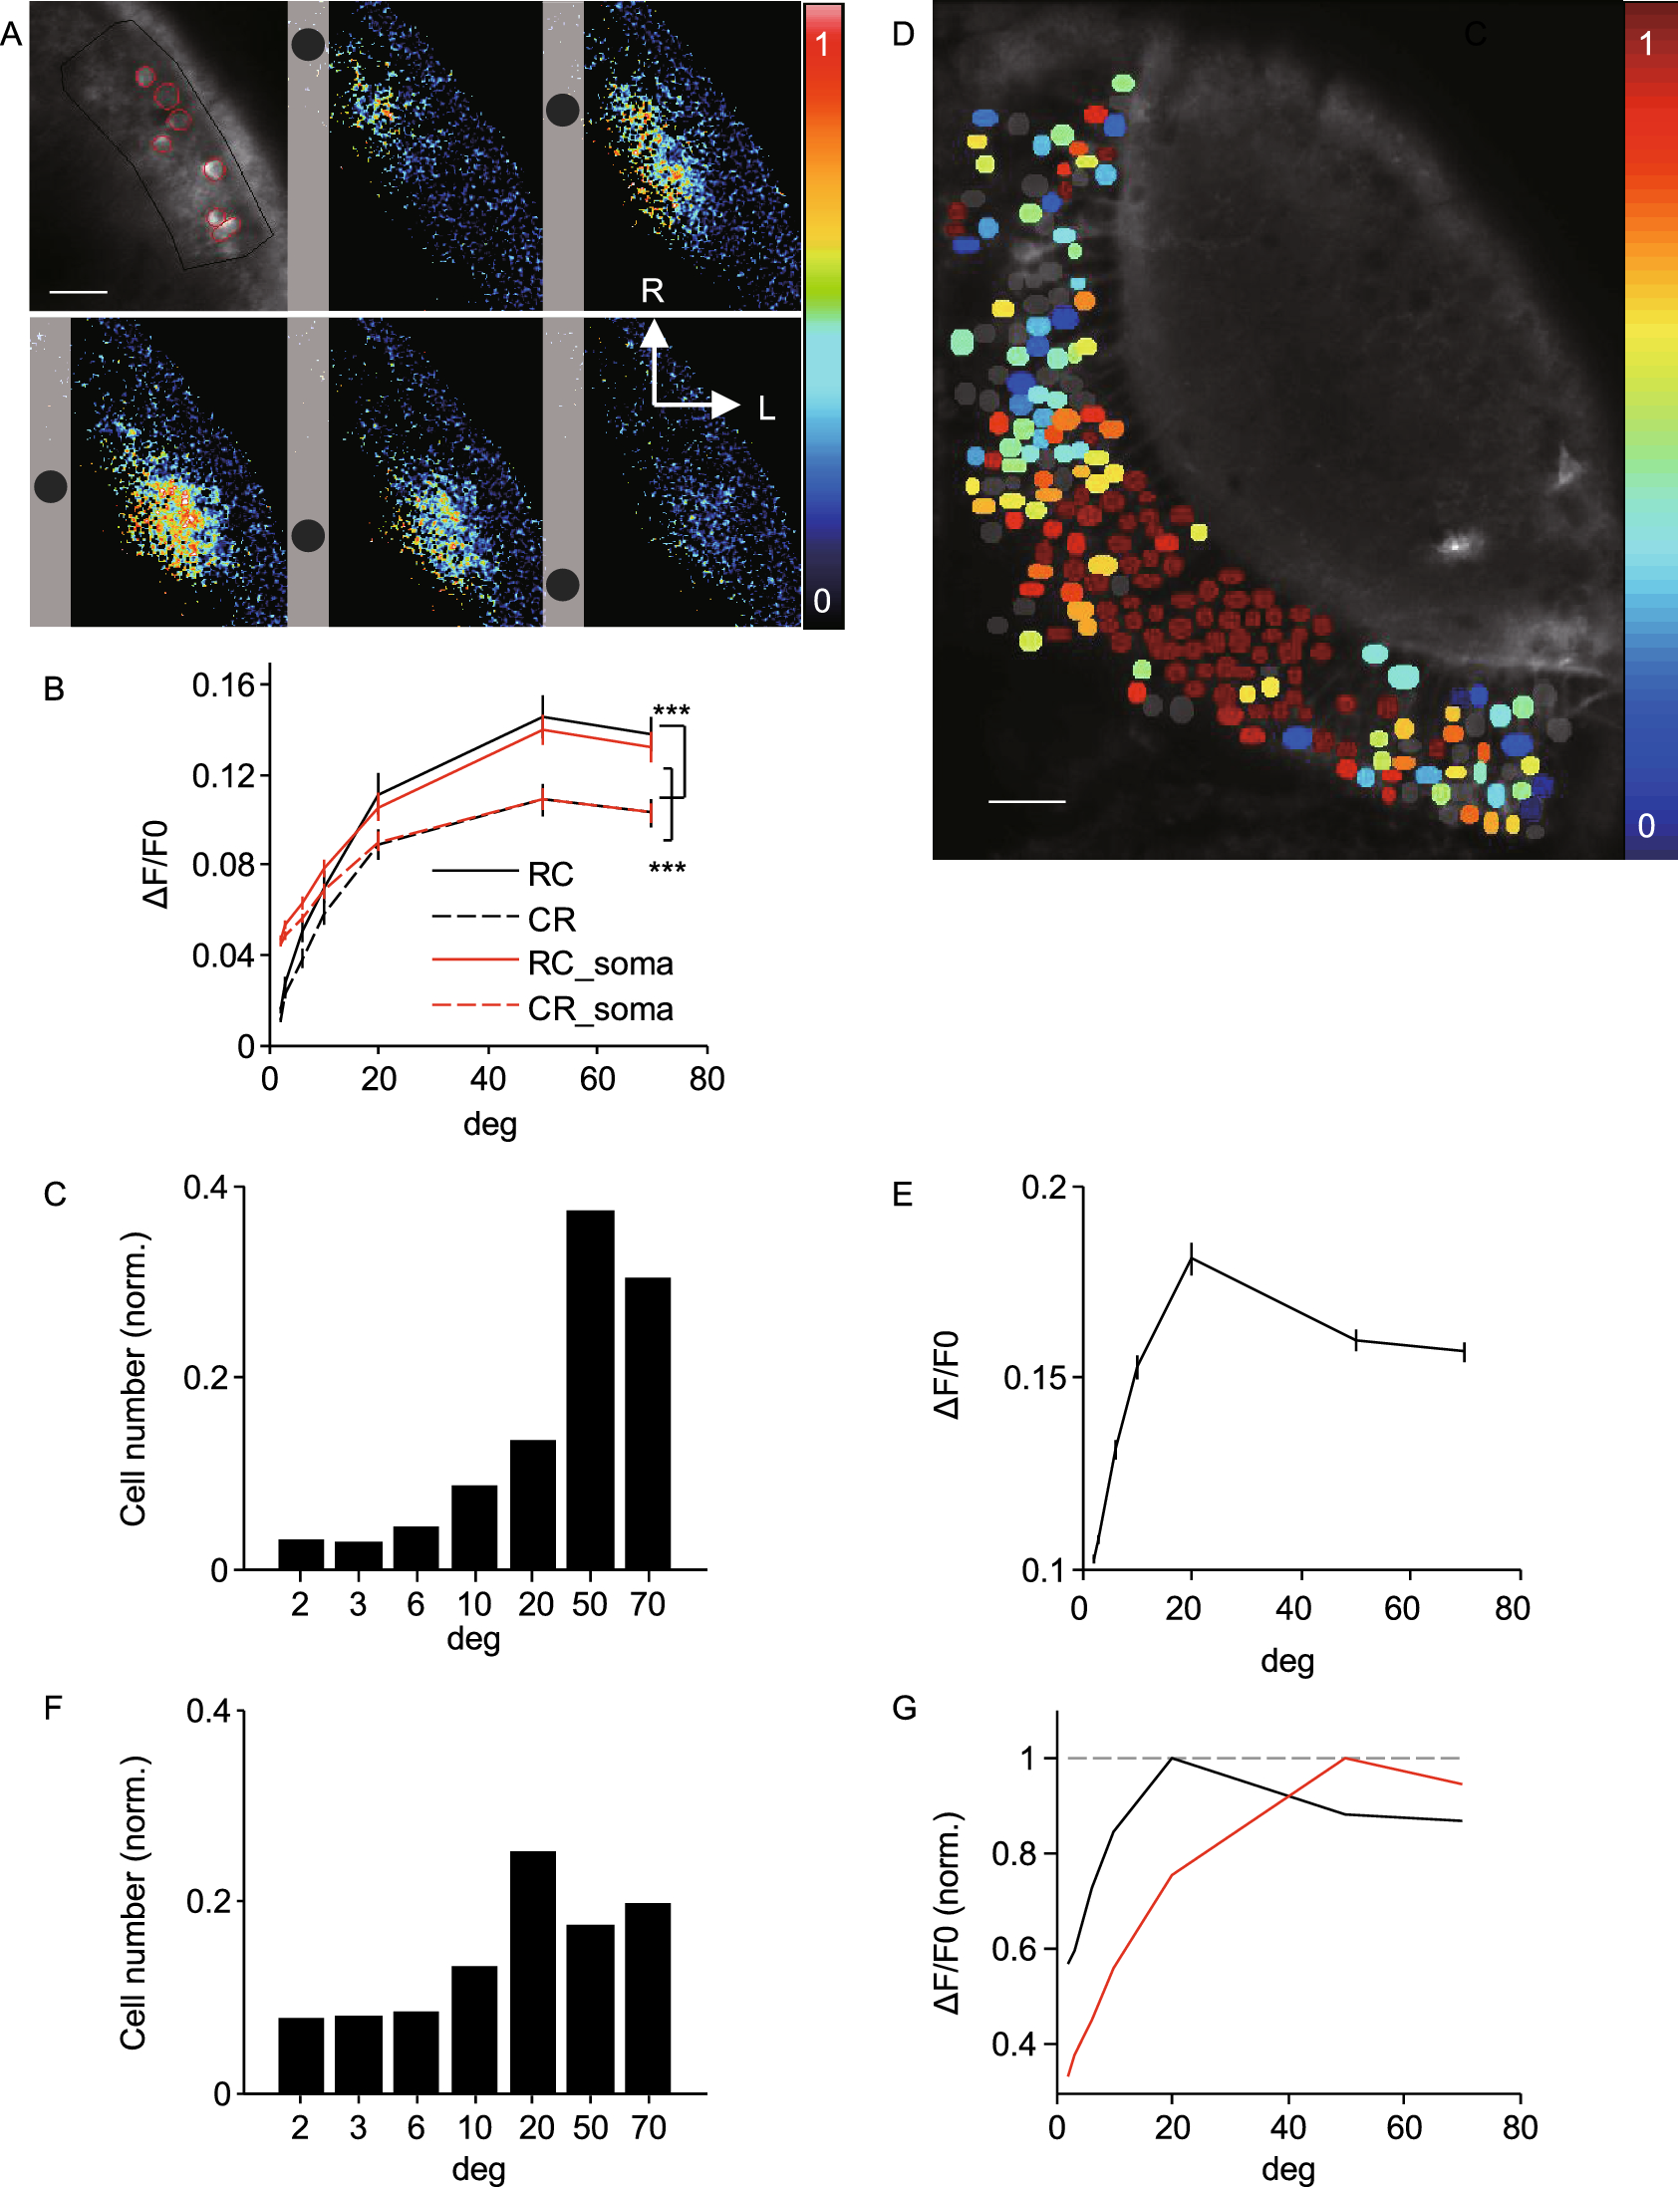
Size tuning of SINs. (A) Montage showing responses of SINs to moving dot stimulus of 10°, color-coded according to normalized responses. Relative position in each panel indicates direction of motion. Top left, fluorescence image showing analyzed ROIs demarcated by lines (population in black; somata in red). (B) Summary of responses to moving dots from population (n = 47 fishes, P = 2.3 × 10⁻¹⁰, two-way ANOVA) and responsive somata (n = 254/338, P = 1.8 × 10⁻⁹, two-way ANOVA). (C) Size preference distribution for all somata (n = 254/338 cells from 47 fishes). (D) Responses of PVNs to moving dot stimulus of 20°, color-coded according to normalized responses. Gray somata showing nonresponsive cells. (E) Summary of responses to moving dots from all somata (n = 1,651). (F) Size preference distribution from all somata. (G) Comparison of tuning curves between SINs (red) and PVNs (black)