
|
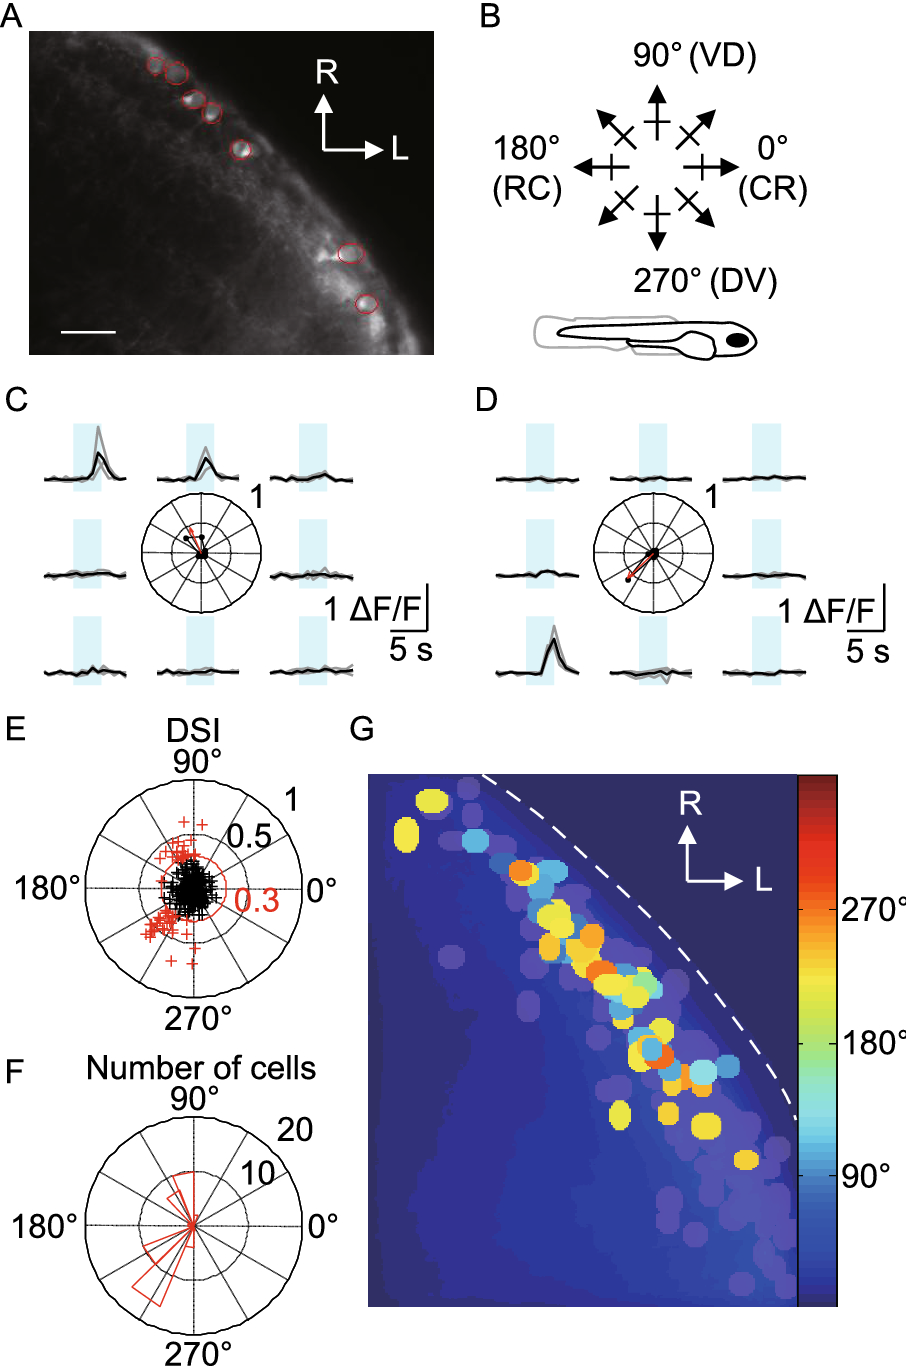
Fig. 2
Direction selectivity of SINs. (A) Fluorescent signal in Gal4s1156t, UAS:GCaMP-HS larva. Region of interests (ROIs) are demarcated by red lines. (B) Schematic showing direction of motion of bars relative to fish body axis (Bottom). VD: ventral to dorsal. DV: dorsal to ventral. (C and D) Ca2+ transients from two somata. Center: polar plot of normalized peak amplitudes of Ca2+ transients. Arrow shows vector sum of normalized peak amplitudes, indicating PD and DSI. (E) DSI and PD for all somata. Red circle marks a DSI of 0.3, used as criterion for DS. (F) Histogram of PDs for all DS cells from (E) in red. (G) All responsive somata from grouped experiments, color-coded according to PD. Gray somata showing responsive but not DS cells (total number of cells imaged: 304; responsive cells: 247, 81.3%). Scale bar, 20 μm