
FIGURE SUMMARY
- Title
-
Cynoglossus semilaevis Rspo3 Regulates Embryo Development by Inhibiting the Wnt/β-Catenin Signaling Pathway.
- Authors
- Niu, J., Guan, J., Li, R., Li, X., Zhai, J., Qi, J., He, Y.
- Source
- Full text @ Int. J. Mol. Sci.
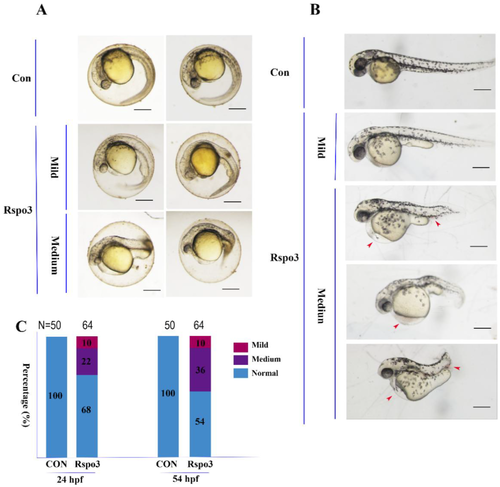
Overexpression of C. semilaevis Rspo3 affects Danio rerio embryo development. An amount of 1000 pg/embryo of C. semilaevis Rspo3 mRNA was injected into AB strain D. rerio embryos at 1–4 cell stages. All embryos are shown with anterior to the left. Scale bar = 200 μm. (A) Classification of phenotypes at 24 h post-fertilization (hpf); (B) Classification of phenotypes at 54 hpf. The red arrowheads indicate ecchymosis; (C) The percentages of embryos in each category as shown in (A) and (B); N is the number of total samples analyzed in each group.
|
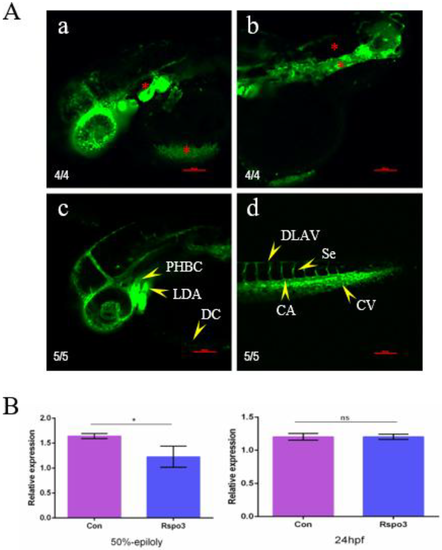
Overexpression of C. semilaevis Rspo3 affects angiogenesis in D. rerio embryos. (A) Vascular abnormalities induced by overexpression of C. semilaevis Rspo3 mRNA at 36 hpf; a and b show the most heavily impacted transgenic (flila: EGFP) strain D. rerio embryos. Each embryo was injected with 700 pg of C. semilaevis Rspo3 mRNA at 1–4 cell stages; c and d are the control group without injection. The yellow arrowheads indicate different types of vessels, whereas the red asterisks point out the abnormalities in the experimental group. All panels show the embryos oriented with anterior to the left. Scale bar = 100 μm. LDA: lateral dorsal aorta, CCV: common cardinal vein, Se: intersegmental vessel, CV: caudal vein, CA: caudal aorta; (B) Expression analysis of VEGFa at the 50%-epiboly stage and 24 hpf. β-actin is the reference gene. The data are shown as mean ± SD (n = 3, N = 30). Values with different superscripts or an asterisk indicate different statistical significance (* p < 0.05; ns p > 0.05).
|

C. semilaevis Rspo3 affects mesoderm formation by regulating the Wnt/β-catenin signaling pathway. (A) AB strain D. rerio 24 hpf embryos after treatment with 0.15 μM BIO or 1.67 μM XAV-939, or microinjection with 1000 pg C. semilaevis Rspo3 mRNA per embryo. All embryos are shown oriented with anterior to the left. Scale bar = 200 μm; (B) Abnormality rates of embryos in each group as shown in (A), N is the number of total samples analyzed in each group; (C) WISH analysis of ntl at the gastrula stage in each group; a–d are lateral views, whereas a’–d’ are quarter views. Scale bar = 200 μm; (D) RT-PCR analysis of ntl at the gastrula stage in each group. β-actin is the reference gene. The data are shown as mean ± SD (n = 3, N = 30). The superscript indicates statistical significance (** p < 0.01).
|
Acknowledgments
This image is the copyrighted work of the attributed author or publisher, and
ZFIN has permission only to display this image to its users.
Additional permissions should be obtained from the applicable author or publisher of the image.
Full text @ Int. J. Mol. Sci.