
- Title
-
Tolerance to paternal genotoxic damage promotes survival during embryo development in zebrafish (Danio rerio).
- Authors
- Fernández-Díez, C., González-Rojo, S., Lombó, M., Herráez, M.P.
- Source
- Full text @ Biol. Open
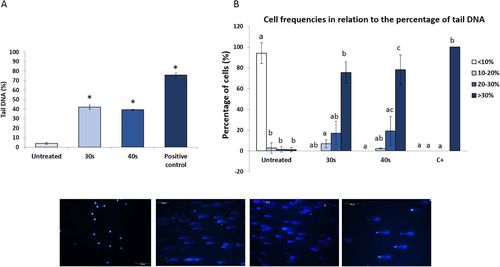
Sperm DNA integrity. (A) Percentage of tail DNA by comet assay. Representative comet assay images (20×) from sperm cells are shown (bottom). Scale bars: 100 μm. (B) Four rates of DNA fragmentation are shown for each type of spermatic cells (untreated sperm and sperm treated with 30 s or 40 s of UV irradiation). Data indicate mean±s.e.m. (n=3). Different letters and asterisks indicate significant differences (P<0.05). |
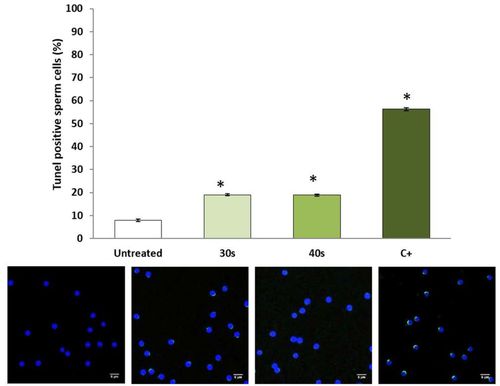
Relative intensity of TUNEL-positive cells. Representative TUNEL images (40×) from sperm cells are shown. Scale bars: 5 µm. Data are mean±s.e.m. (n=3) (*P<0.05). |
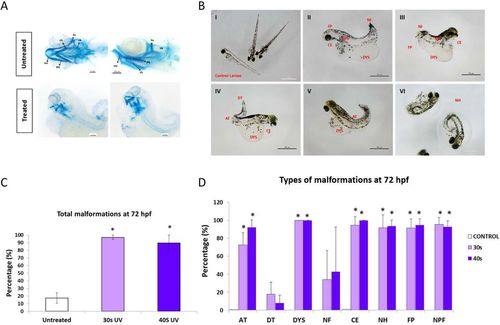
Phenotypes of larvae from untreated sperm and sperm treated with 30 s and 40 s of UV irradiation. (A) Representation of mandibular cartilage from zebrafish embryos at 6 dpf. mc, Meckel's cartilage; pq, palatoquadrate; bh, basihyal; ch, ceratohyal; hs, hyosymplectic; cb, ceratobranchial. Scale bars: 100 µm. (B) Types of malformations observed at 72 hpf. AT, axial torsion; DT, distal torsion; DYS, defective yolk sac; NF, no fin; CE, cardiac edema; NH, no hatching; FP, failed pigmentation; NPF, no pectoral fin. Scale bars: 500 µm. (C) Percentage of total malformations. (D) Percentage of specific malformations. Data are mean±s.e.m. (n=3) (*P<0.05). |
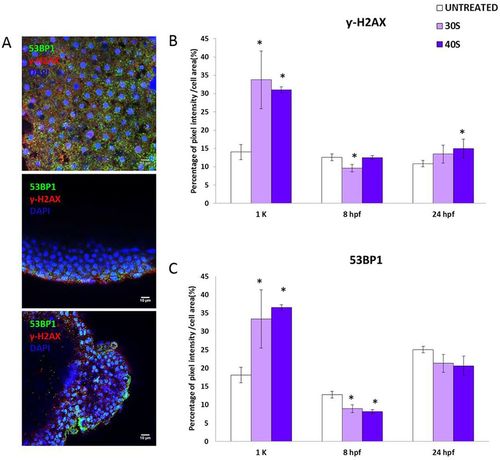
Repairing ability during embryo development at 1k-cell, 8 hpf, 24 hpf and 72 hpf in progenies from untreated sperm and sperm treated with 30 s and 40 s of UV irradiation. (A) 53BP1 and γ-H2AX immunolocalization. Representative confocal images (40×) of whole embryos. Cell nuclei were stained with DAPI. Scale bars: 10 µm. (B) Percentage of pixel intensity per cellular area for γ-H2AX. (C) Percentage of pixel intensity per cellular area for 53BP1. Data are mean±s.e.m. (n=3) (*P<0.05). |
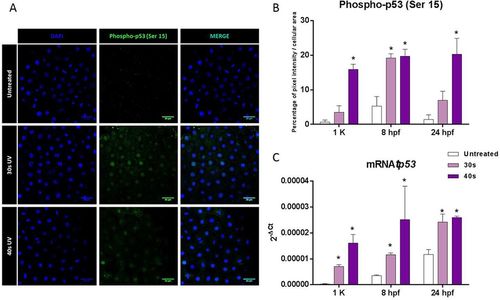
The guardian of the genome: p53. (A) Phopho-p53 (Ser 15) immunolocalization. Representative confocal images (40×) of whole embryos. Cell nuclei were stained with DAPI. Scale bars: 24 µm. (B) Percentage of pixel intensity of phospho-p53 (Ser 15) per cellular area. (C) mRNA levels of tp53 at different stages during development (1k-cell, 8 hpf and 24 hpf) in progenies obtained from untreated sperm and sperm treated with 30 s and 40 s of UV irradiation. Data are mean±s.e.m. (n=3) (*P<0.05). |