
- Title
-
Bidirectional approaches for optogenetic regulation of gene expression in mammalian cells using Arabidopsis cryptochrome 2
- Authors
- Pathak, G.P., Spiltoir, J.I., Höglund, C., Polstein, L.R., Heine-Koskinen, S., Gersbach, C.A., Rossi, J., Tucker, C.L.
- Source
- Full text @ Nucleic Acids Res.
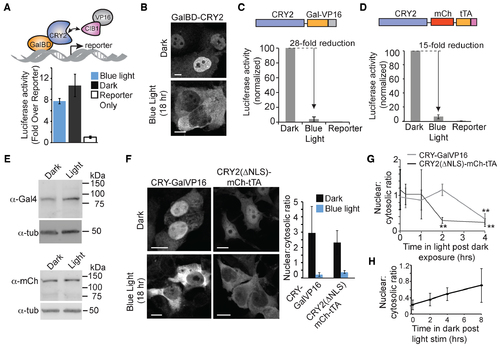
CRY2-fused transcription factors are cleared in the nucleus with light. (A) Schematic and luciferase activity of mammalian split transcriptional system using GalBD-CRY2 and VP16AD-CIB1. HEK293T cells were transfected with the AD and BD constructs and a GalUAS-luciferase reporter, then incubated in dark or exposed to light pulses for 18 h before assaying for luciferase activity. Fold increase in luciferase activity is shown compared to reporter only controls. Data represents average and error (s.d.) for three independent experiments. (B) Representative HEK293T cells expressing GalBD-CRY2 kept in dark or exposed to blue light pulses for 18 hrs., immunostained using an anti-Gal4BD antibody. Scale bar, 10 μm (C and D) Luciferase activity of HEK293 cells expressing CRY-GalVP16 and a GalUAS-luciferase reporter (C) or CRY2ΔNLS-mCh-tTA and a 7xtetO-luciferase reporter (D) incubated 18 h in dark or with blue light pulses. Data represents average and error (s.d.) for three independent experiments. (E) Immunoblot of HEK293T cells expressing CRY-GalVP16 (top) or CRY2ΔNLS-mCh-tTA (bottom) and exposed to dark or light pulses for 18 h. Samples were also blotted with α-tubulin as a loading control. (F) Representative immunostaining (CRY-GalVP16, Gal4BD antibody) or fluorescence (CRY2(ΔNLS)-mCh-tTA) images showing localization of CRY2-fused proteins exposed to dark or light for 18 h. The ratio of nuclear:cytosolic protein from multiple cells is quantified in graph at right. Data represents average and error (s.d., n = 10). Scale bar, 10 μm. (G) Kinetics of nuclear clearing. Cells expressing CRY2 fusion constructs were incubated in dark for 16 h, then exposed to blue light pulses for indicated times before fixation. The ratio of nuclear:cytosolic protein from fixed cells was then quantified. Data represents average and error (s.d., n = 4). **P-value < .05. (H) Reversibility of phenotype. HEK293T cells expressing CRY2(ΔNLS)-mCh-tTA were treated with light for 18 h, then incubated in dark for indicated times before fixing and quantifying nuclear:cytoplasmic ratio as in (G). Data represents average and error (s.d., n = 8). |
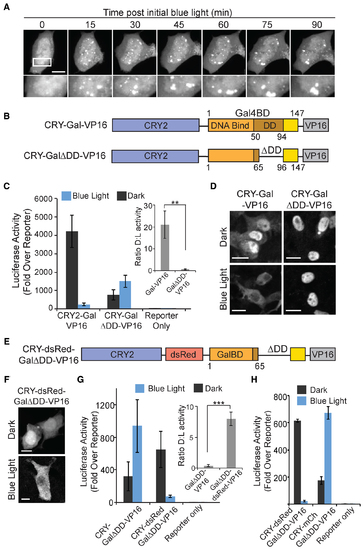
A CRY2-fused dimerization domain is required for light-dependent nuclear clearing and functional loss of activity. (A) Live cell imaging showing formation of CRY2(ΔNLS)-mCh-tTA clusters in the nucleus upon initial light exposure, which coalesce into larger puncta over the 90 min timecourse. Scale bar, 10 μm. (B) Schematic showing constructs used in (C) and (D). CRY-GalΔDD-VP16 contains Gal4BD residues 1–147 but is missing residues 66–95, which are important for dimerization. (C) Luciferase activity of cells expressing indicated constructs exposed to 18 h dark or blue light pulses. Data represents average and error (s.e.m.) from four independent experiments. Inset shows the ratio of activity in dark to activity in light. **P-value < .05. (D) Localization of protein fusions in HEK293T cells, assayed by immunohistochemistry using an anti-Gal4BD antibody. Cells were treated as in (C). (E–G) Addition of a tetramerizing dsRed domain restores light response to CRY-GalΔDD-VP16. (E) Schematic of construct used in (F) and (G). (F) Representative HEK293T cells expressing CRY-dsRed-GalΔDD-VP16, exposed to 18 h dark or blue light pulses, and assayed for localization as in (C). (G) Luciferase activity of cells expressing CRY-GalΔDD-VP16 alone or with an added back multivalent domain (CRY-dsRed-GalΔDD-VP16) assayed as in (C). Data represents average and error (s.e.m.) for three independent experiments. Inset shows the ratio of activity in dark to activity in light. ***P-value < .005. (H) Comparison of effect of adding back a tetramerizing dsRed domain versus a monomeric mCherry domain to CRY-GalΔDD-VP16. Luciferase assay was carried out as in (C). Data represents average and error (s.d., n = 3) from one experiment, and experiments were repeated two times with similar results. |

Optimization of split CRY2/CIB1 transcriptional system. (A) Schematic and immunostaining of new CRY2-BD construct (CRY-Gal(1–65)) assayed in split transcriptional system. HEK293T cells expressing CRY2-Gal(1–65) were kept in dark or exposed to blue light pulses for 18 h, then assayed for immunohistochemistry using an anti-Gal4BD antibody. (B) Luciferase activity of HEK293T cells expressing indicated constructs and a GalUAS-luciferase reporter and exposed to dark or blue light pulses as in (A) for 18 h. Data represents average and error (s.d., n = 3). Experiments were repeated two times with similar results. (C) Comparison of activation domain fusions. HEK293T cells were transiently transfected with CRY2-Gal(1–65) and indicated AD-fusion constructs, along with a GalUAS-luciferase reporter and tested for activity as in (B). Data represents average and error (s.d., n = 3). Experiments were repeated three times with similar results. (D) Immunoblot of HEK293T cells expressing a GalUAS-GFP-HA reporter with CRY2-Gal(1–65) and CIB1-VP64 incubated in dark or blue light for 18 h. (E) Spatial regulation. HEK293T cells expressing CRY-Gal(1–65), VP64-CIB1, and a GalUAS-GFP reporter were exposed to 18 h patterned blue light, followed by imaging of GFP reporter expression. Scale bar, 1 cm. (F) Dose-dependent regulation. HEK293T cells expressing constructs as in (E) were illuminated with varying light intensities for 18 h, followed by immunoblotting using an anti-GFP antibody or anti-tubulin control. |
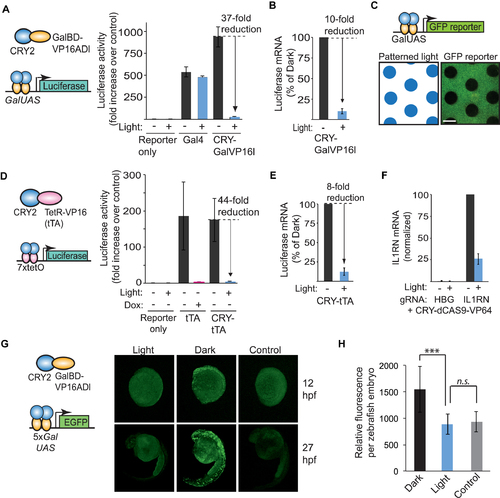
Light-mediated disruption of transcription. (A) Schematic and luciferase activity of optimized light disrupted system. HEK293T cells were transiently transfected with a GalUAS-luciferase reporter and control DNA (reporter only), CRY-GalVP16l, or intact Gal4, grown for 24 h in dark or pulsed blue light, then assayed for luciferase activity. Fold increase in luciferase activity is shown compared to reporter controls. Data represents average and error (s.d., n = 3). (B) Quantitative RT-PCR showing luciferase mRNA levels in cells transfected as in (A) and harvested after 22 h. Shown is the average and range from two independent experiments (experiments were repeated two additional times with similar results). (C) Spatial regulation. HEK293T cells transiently transfected with CRY-GalVP16l and a GalUAS-GFP reporter were exposed to patterned blue light for 18 h before imaging. Scale bar, 1 cm. (D) Schematic and luciferase activity of HEK293T cells transiently transfected with a 7xtetO-luciferase reporter and either CRY-tTA, tTA or control DNA (reporter only). Luciferase activity was measured after 24 h. incubation in dark or blue light pulses. Doxycycline samples included 0.5 μM doxycycline. Data represents average and error (s.d.) from three independent experiments. (E) Quantitative RT-PCR showing the levels of luciferase mRNA in HEK293T cells transfected as in (D) and harvested after 22 h. Data represents average and standard deviation from three independent assays. (F) Light regulation of endogenous IL1RN transcription using a CRISPR/dCAS9-based approach. HEK293T cells were transfected with CRY-dCas9-VP64 and IL1RN or HBG1-targeted gRNAs and exposed to light (1 s pulses every 15 s) or dark for 3 days. Data represents average and range for two independent experiments (three replicates each). (G) In vivo testing of CRY-GalVP16l in GalUAS-GFP reporter zebrafish embryos. Embryos were injected with 20 pg CRY-GalVP16l DNA at the one-cell stage and then incubated (after a 3 h recovery period) in the dark or light (10 s pulse every 3 min, 470 nm, 5 mW/cm2). GFP images of representative embryos were acquired at 12 and 27 hpf. Controls show images of non-injected embryos at 12 and 27 hpf. (H) Quantification of zebrafish embryo fluorescence. Embryos treated as described in (G) were imaged then quantified for total fluorescence (n = 7–9 embryos each condition). Control embryos showed significant autofluorescence as indicated. ***P-value < .005. n.s., not significant. |