
Fig. 1
- ID
- ZDB-FIG-180403-6
- Publication
- Pathak et al., 2017 - Bidirectional approaches for optogenetic regulation of gene expression in mammalian cells using Arabidopsis cryptochrome 2
- Other Figures
- All Figure Page
- Back to All Figure Page
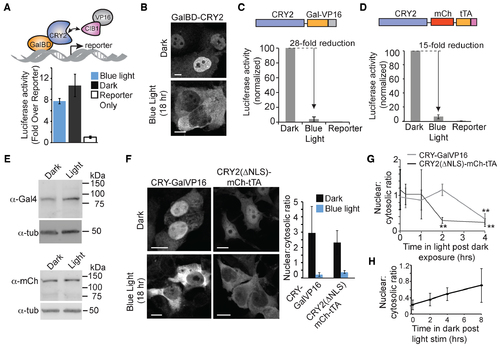
CRY2-fused transcription factors are cleared in the nucleus with light. (A) Schematic and luciferase activity of mammalian split transcriptional system using GalBD-CRY2 and VP16AD-CIB1. HEK293T cells were transfected with the AD and BD constructs and a GalUAS-luciferase reporter, then incubated in dark or exposed to light pulses for 18 h before assaying for luciferase activity. Fold increase in luciferase activity is shown compared to reporter only controls. Data represents average and error (s.d.) for three independent experiments. (B) Representative HEK293T cells expressing GalBD-CRY2 kept in dark or exposed to blue light pulses for 18 hrs., immunostained using an anti-Gal4BD antibody. Scale bar, 10 μm (C and D) Luciferase activity of HEK293 cells expressing CRY-GalVP16 and a GalUAS-luciferase reporter (C) or CRY2ΔNLS-mCh-tTA and a 7xtetO-luciferase reporter (D) incubated 18 h in dark or with blue light pulses. Data represents average and error (s.d.) for three independent experiments. (E) Immunoblot of HEK293T cells expressing CRY-GalVP16 (top) or CRY2ΔNLS-mCh-tTA (bottom) and exposed to dark or light pulses for 18 h. Samples were also blotted with α-tubulin as a loading control. (F) Representative immunostaining (CRY-GalVP16, Gal4BD antibody) or fluorescence (CRY2(ΔNLS)-mCh-tTA) images showing localization of CRY2-fused proteins exposed to dark or light for 18 h. The ratio of nuclear:cytosolic protein from multiple cells is quantified in graph at right. Data represents average and error (s.d., n = 10). Scale bar, 10 μm. (G) Kinetics of nuclear clearing. Cells expressing CRY2 fusion constructs were incubated in dark for 16 h, then exposed to blue light pulses for indicated times before fixation. The ratio of nuclear:cytosolic protein from fixed cells was then quantified. Data represents average and error (s.d., n = 4). **P-value < .05. (H) Reversibility of phenotype. HEK293T cells expressing CRY2(ΔNLS)-mCh-tTA were treated with light for 18 h, then incubated in dark for indicated times before fixing and quantifying nuclear:cytoplasmic ratio as in (G). Data represents average and error (s.d., n = 8). |