
|
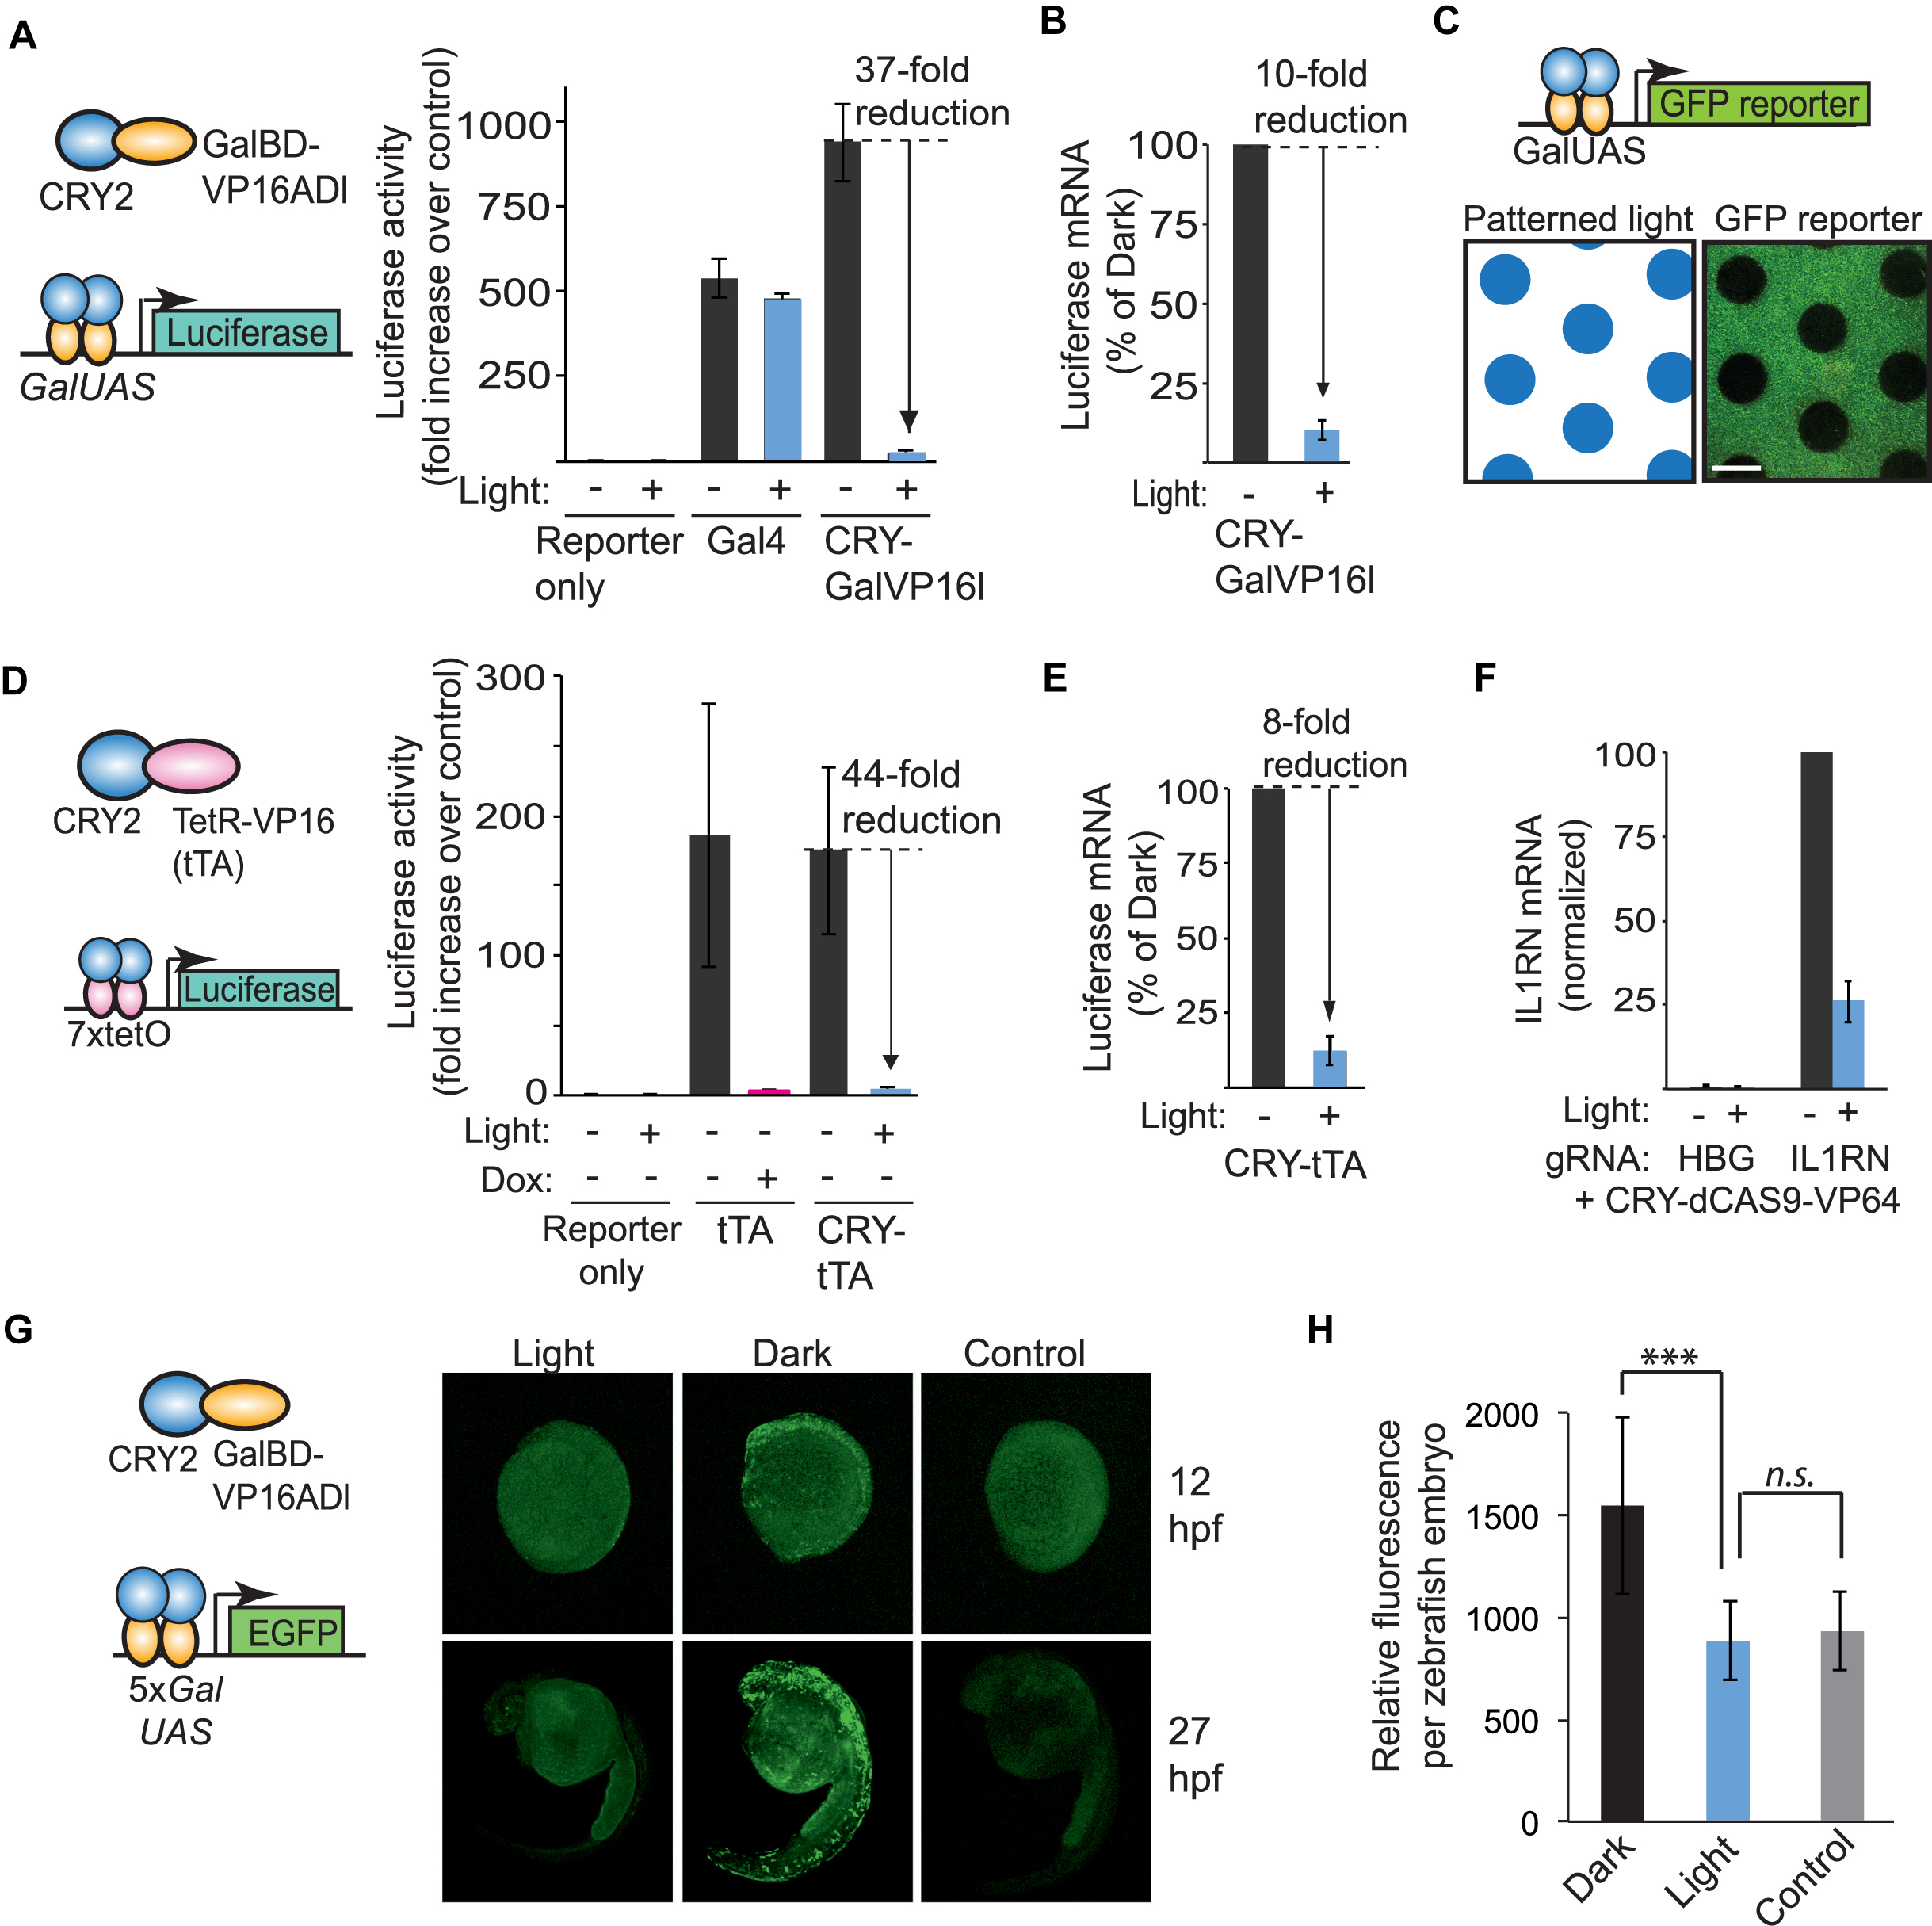
Fig. 4 Light-mediated disruption of transcription. (A) Schematic and luciferase activity of optimized light disrupted system. HEK293T cells were transiently transfected with a GalUAS-luciferase reporter and control DNA (reporter only), CRY-GalVP16l, or intact Gal4, grown for 24 h in dark or pulsed blue light, then assayed for luciferase activity. Fold increase in luciferase activity is shown compared to reporter controls. Data represents average and error (s.d., n = 3). (B) Quantitative RT-PCR showing luciferase mRNA levels in cells transfected as in (A) and harvested after 22 h. Shown is the average and range from two independent experiments (experiments were repeated two additional times with similar results). (C) Spatial regulation. HEK293T cells transiently transfected with CRY-GalVP16l and a GalUAS-GFP reporter were exposed to patterned blue light for 18 h before imaging. Scale bar, 1 cm. (D) Schematic and luciferase activity of HEK293T cells transiently transfected with a 7xtetO-luciferase reporter and either CRY-tTA, tTA or control DNA (reporter only). Luciferase activity was measured after 24 h. incubation in dark or blue light pulses. Doxycycline samples included 0.5 μM doxycycline. Data represents average and error (s.d.) from three independent experiments. (E) Quantitative RT-PCR showing the levels of luciferase mRNA in HEK293T cells transfected as in (D) and harvested after 22 h. Data represents average and standard deviation from three independent assays. (F) Light regulation of endogenous IL1RN transcription using a CRISPR/dCAS9-based approach. HEK293T cells were transfected with CRY-dCas9-VP64 and IL1RN or HBG1-targeted gRNAs and exposed to light (1 s pulses every 15 s) or dark for 3 days. Data represents average and range for two independent experiments (three replicates each). (G) In vivo testing of CRY-GalVP16l in GalUAS-GFP reporter zebrafish embryos. Embryos were injected with 20 pg CRY-GalVP16l DNA at the one-cell stage and then incubated (after a 3 h recovery period) in the dark or light (10 s pulse every 3 min, 470 nm, 5 mW/cm2). GFP images of representative embryos were acquired at 12 and 27 hpf. Controls show images of non-injected embryos at 12 and 27 hpf. (H) Quantification of zebrafish embryo fluorescence. Embryos treated as described in (G) were imaged then quantified for total fluorescence (n = 7–9 embryos each condition). Control embryos showed significant autofluorescence as indicated. ***P-value < .005. n.s., not significant.