
- Title
-
Homocysteine-induced peripheral microcirculation dysfunction in zebrafish and its attenuation by L-arginine
- Authors
- Lee, S.J., Park, S.H., Chung, J.F., Choi, W., Huh, H.K.
- Source
- Full text @ Oncotarget

Schematics of the vascular network of a 10 dpf zebrafish. Vessels are composed of the dorsal artery (DA), posterior cardinal vein (PCV), caudal vein (CV), and subintestinal vein (SIV). Each region of interest (ROI) is represented by dotted box. The time-averaged RBC velocity and peak systolic RBC velocity in the DA are defined as and , respectively. The time-averaged RBC velocities in the PCV and CV regions are defined as |

ZFIN is incorporating published figure images and captions as part of an ongoing project. Figures from some publications have not yet been curated, or are not available for display because of copyright restrictions. PHENOTYPE:
|
|
ZFIN is incorporating published figure images and captions as part of an ongoing project. Figures from some publications have not yet been curated, or are not available for display because of copyright restrictions. PHENOTYPE:
|
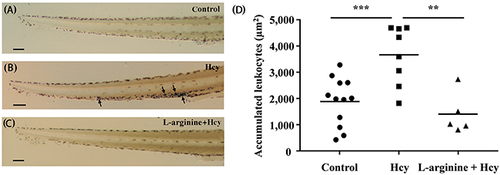
Accumulation of neutrophils in the tail region. The stained neutrophils in the tail region of (A) control, (B) the 100 μM Hcy-exposed, and (C) the 50 μM L-arginine pretreated 100 μM Hcy-exposed zebrafish are visualized. Arrows indicate significantly aggregated neutrophils. (D) The areas with accumulated neutrophils in the tail region are quantitatively compared. n = 5–12 per group; **p<0.01 and *** p<0.001 (one-way ANOVA with Newman-Keuls’s post-test). Control, control zebrafish without any treatment; Hcy, Hcy-exposed zebrafish; L-arginine + Hcy, L-arginine pretreated Hcy-exposed zebrafish. Scale bar denotes 100 μm. PHENOTYPE:
|