
|
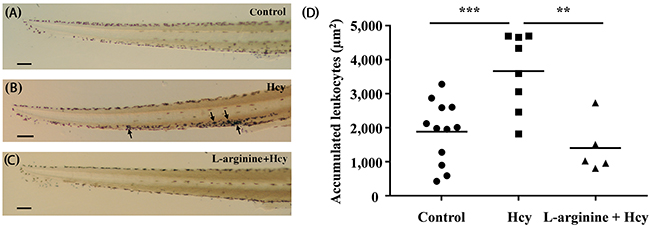
Fig. 5
Accumulation of neutrophils in the tail region. The stained neutrophils in the tail region of (A) control, (B) the 100 μM Hcy-exposed, and (C) the 50 μM L-arginine pretreated 100 μM Hcy-exposed zebrafish are visualized. Arrows indicate significantly aggregated neutrophils. (D) The areas with accumulated neutrophils in the tail region are quantitatively compared. n = 5–12 per group; **p<0.01 and *** p<0.001 (one-way ANOVA with Newman-Keuls’s post-test). Control, control zebrafish without any treatment; Hcy, Hcy-exposed zebrafish; L-arginine + Hcy, L-arginine pretreated Hcy-exposed zebrafish. Scale bar denotes 100 μm.