
- Title
-
Hemodynamic forces can be accurately measured in vivo with optical tweezers
- Authors
- Harlepp, S., Thalmann, F., Follain, G., Goetz, J.G.
- Source
- Full text @ Mol. Biol. Cell
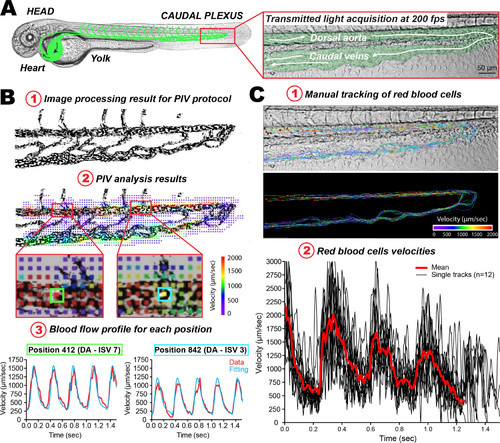
Fine measurements of blood flow velocities in the ZF embryo. (A) Experimental workflow: a representative image of a 48 hpf ZF embryo image is presented (the vasculature network is schematized in green), and a zoom of the caudal plexus region is presented in a separate box. (B) PIV analysis: 1) the images resulting from high-speed acquisition of the blood flow (200 fps) were processed such that high contrast is obtained for circulating RBCs. 2) The PIV analysis provides a color-coded velocity map over the entire image, in any region of interest. Flow profiles can thus be extracted at any given position. This further allows theoretical analysis of the flow values, which will be used in the simulation used for measuring the trap stiffness. 3) Here two positions, with distinct flow profiles and separated by roughly 250 µm, are presented. Note the different flow profiles that can be observed and fitted. (C) Particle tracking analysis. Manual tracking of individual RBCs in perfused vessels can be performed. 1) Several tracks obtained over 12 RBCs are displayed. Tracks are color-coded according to their instantaneous velocity. Note the higher values and pulsatility obtained in the DA. 2) Instantaneous velocity frame after frame is plotted over a track spanning the entire caudal plexus, for 12 RBCs. |
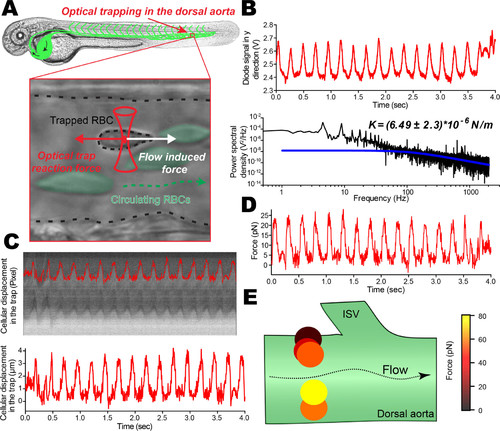
Optical trapping of circulating RBCs, image analysis and photodiode measurements. (A) Scheme of the experiment where the optical trap is located in the caudal plexus (DA) of the ZF embryo. The trapped RBC is subjected to the blood flow–driven dragging force as well as to the restoring force from the optical trap. (B) Thanks to the flow pulsatility occurring in arterial vessels, the time trace of the optically trapped RBC is followed on the quadrant diode. The time trace is further treated to access the power spectrum (black curve), revealing peaks of pulsatility as well as a corner frequency fc around 250 Hz. This is highlighted with the theoretical curve for steady optical trapping experiments (blue curve). The cutoff frequency, obtained from a Lorentzian approximation, provides a first approximation of the trap stiffness, which is ∼4.7*10–5 N/m. (C) A kymographic analysis of a single trapped RBC imaged at 200 fps is performed. Kymographs allow fine tracking of RBC displacement within the optical trap, thereby providing a real time track in micrometers. (D) A mirror force track over time is obtained and results from the use of the theoretical trap stiffness derived from the cutoff frequency (theoretical curve). (E) Any given position in the ZF vasculature can be probed, providing an accurate measure of hemodynamic forces. Here a few trapping RBCs in a cross-section of the DA permit appreciation of the behavior of a Poiseuille-type of flow. |
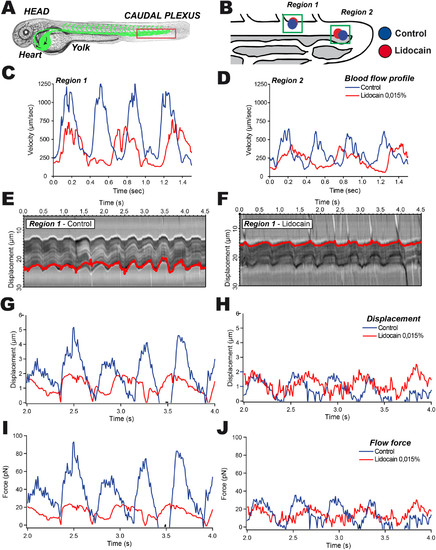
The impact of blood flow tuning on hemodynamic forces can be accurately measured using calibrated optical tweezing. (A) A representative image of the ZF embryo at 48 hpf is provided; the region of interest is highlighted in red. Blood flow tuning is achieved by pretreating the embryos with lidocaine (0.0015%). (B) Two positions within the caudal region of the DA are probed with OT. (C, D) PIV tracks are obtained from high-speed imaging and analysis of region 1 (C) and region 2 (D). (E, F) Kymographic analysis of the optically trapped RBC in region 1 in control (E) and lidocaine-treated (F) embryos. The displacement track is represented in red. (G, H) Displacement of the trapped RBC is measured and plotted in region 1 (G) and region 2 (H). (I, J) Force curves from region 1 (I) and 2 (J) are extracted from the displacement of RBCs within the calibrated optical trap. |