
|
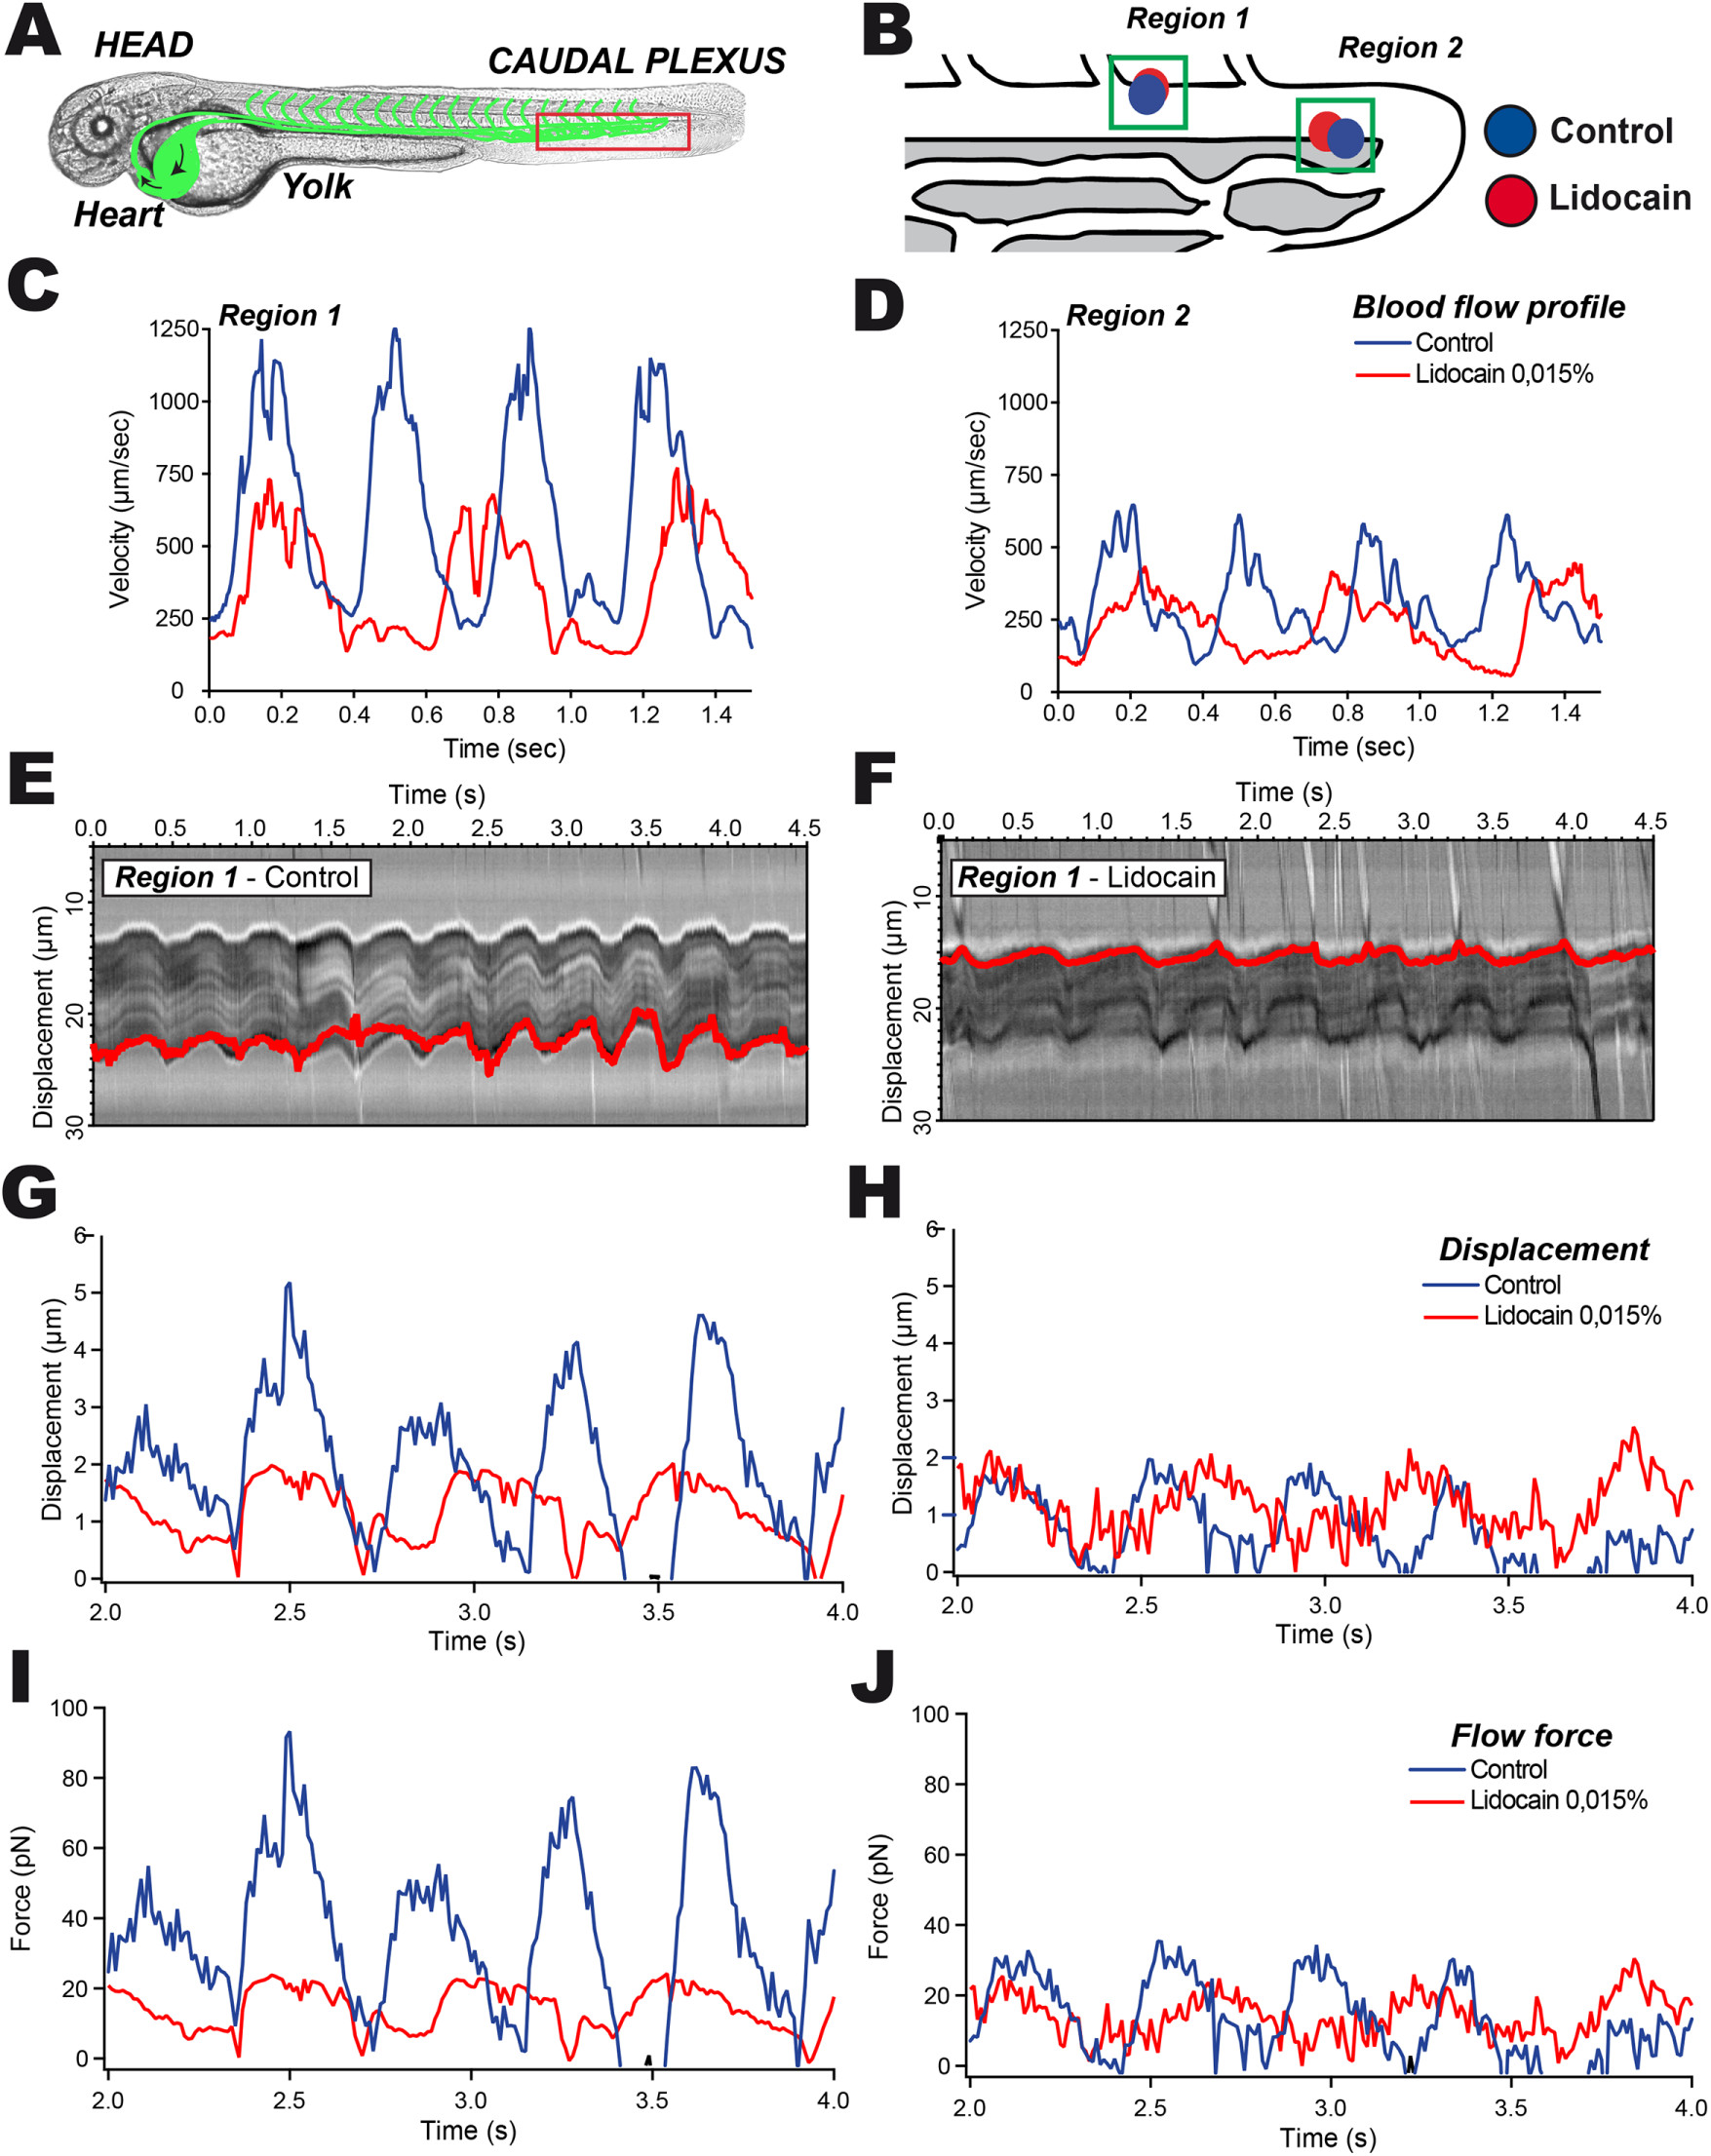
Fig. 4
The impact of blood flow tuning on hemodynamic forces can be accurately measured using calibrated optical tweezing. (A) A representative image of the ZF embryo at 48 hpf is provided; the region of interest is highlighted in red. Blood flow tuning is achieved by pretreating the embryos with lidocaine (0.0015%). (B) Two positions within the caudal region of the DA are probed with OT. (C, D) PIV tracks are obtained from high-speed imaging and analysis of region 1 (C) and region 2 (D). (E, F) Kymographic analysis of the optically trapped RBC in region 1 in control (E) and lidocaine-treated (F) embryos. The displacement track is represented in red. (G, H) Displacement of the trapped RBC is measured and plotted in region 1 (G) and region 2 (H). (I, J) Force curves from region 1 (I) and 2 (J) are extracted from the displacement of RBCs within the calibrated optical trap.