
Fig. 1
- ID
- ZDB-FIG-180329-23
- Publication
- Harlepp et al., 2017 - Hemodynamic forces can be accurately measured in vivo with optical tweezers
- Other Figures
- All Figure Page
- Back to All Figure Page
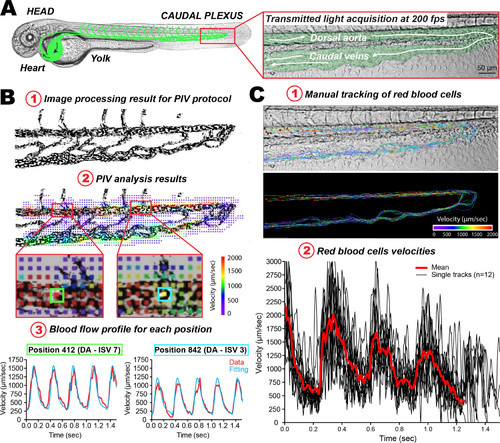
Fine measurements of blood flow velocities in the ZF embryo. (A) Experimental workflow: a representative image of a 48 hpf ZF embryo image is presented (the vasculature network is schematized in green), and a zoom of the caudal plexus region is presented in a separate box. (B) PIV analysis: 1) the images resulting from high-speed acquisition of the blood flow (200 fps) were processed such that high contrast is obtained for circulating RBCs. 2) The PIV analysis provides a color-coded velocity map over the entire image, in any region of interest. Flow profiles can thus be extracted at any given position. This further allows theoretical analysis of the flow values, which will be used in the simulation used for measuring the trap stiffness. 3) Here two positions, with distinct flow profiles and separated by roughly 250 µm, are presented. Note the different flow profiles that can be observed and fitted. (C) Particle tracking analysis. Manual tracking of individual RBCs in perfused vessels can be performed. 1) Several tracks obtained over 12 RBCs are displayed. Tracks are color-coded according to their instantaneous velocity. Note the higher values and pulsatility obtained in the DA. 2) Instantaneous velocity frame after frame is plotted over a track spanning the entire caudal plexus, for 12 RBCs. |