
- Title
-
4-dimensional functional profiling in the convulsant-treated larval zebrafish brain
- Authors
- Winter, M.J., Windell, D., Metz, J., Matthews, P., Pinion, J., Brown, J.T., Hetheridge, M.J., Ball, J.S., Owen, S.F., Redfern, W.S., Moger, J., Randall, A.D., Tyler, C.R.
- Source
- Full text @ Sci. Rep.
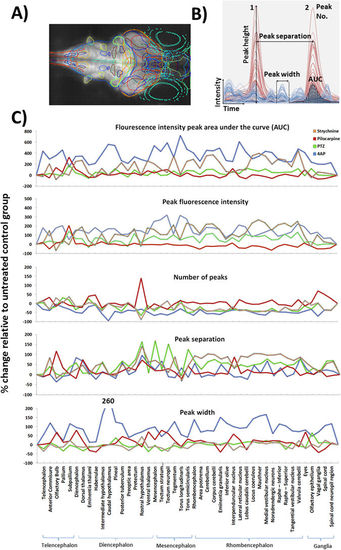
Results of the profile peak analysis. (A) Maximum intensity projection through a larva with overlays showing the positions of the 45 registered anatomical regions. (B) The various peak analysis parameters automatically quantified for each registered anatomical region, within each fish, are defined in panel B. For illustrative purposes only partial example profiles for a PTZ-exposed (red) and control fish (blue) are shown and the various parameters highlighted on these traces. (C) Peak profile analysis data for each region across treatments. The treatment group shown is that at which the highest activity was observed (Top concentrations for 4AP, pilocarpine and strychnine, and 2.5 mM for PTZ due to a slight dip in neural activity at the highest treatment level) Each data point is the mean across all fish/treatment group expressed as the % change versus the mean of the corresponding control group (F1 − F0)/F0*100, where F1 = treated group value, and F0 = control group value. Note that for the AUC and the peak height profiles, 4AP data were divided by 10 to allow plotting on the same axis. Data also summarised in Supplementary Figure 5. |
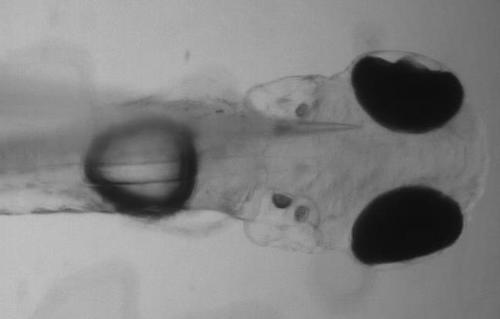
Placement of glass electrode in the optic tectum of GCaMP6s:elavl3 zebrafish larvae. Immobilised 4 dpf elavl3:GCaMP6s larval zebrafish fixed and positioned in 1% LMP agarose dorsal side up to facilitate glass electrode access for placement in the optic tectum. The transparent nature of elavl3:GCaMP6s zebrafish permits precise electrode placement in specific central nervous system (CNS) structures. |
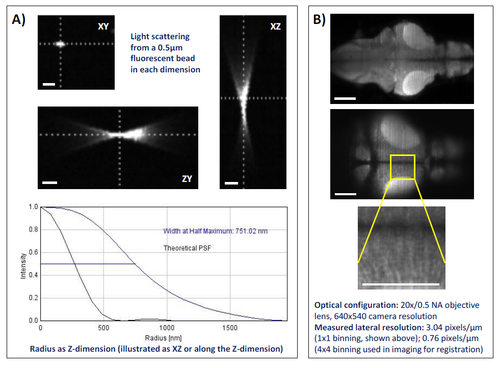
Summary of achievable 3D and spatial resolution using the LSM system set up used for whole brain neuropharmacological profiling. Panel A) shows the Point Spread Function (PSF) estimation averaged across 50 x 0.5μm fluorescent beads (Emission wavelength: 525nm, Merck Milipore, Haarlerbergweg, The Netherlands) in a 1.5μm step scan using MOSAICsuite (http://imagej.net/MOSAICsuite). The scale bar represents circa. 10μm. Panel B) shows a diagrammatic representation of the spatial resolution achievable with the LSM settings used in the current study. Shown are a maximum intensity projection of the whole scan area (top); resolution in a single slice at the top of this stack (middle); and detail from this slice (bottom) in which individual cell bodies are clearly visible. The scale bar represents circa. 100μm. Images were obtained on the 5.5MP sCMOS camera used throughout the study (30FPS, 640x540 pixels, 4x4 binning, 40ms exposure). |
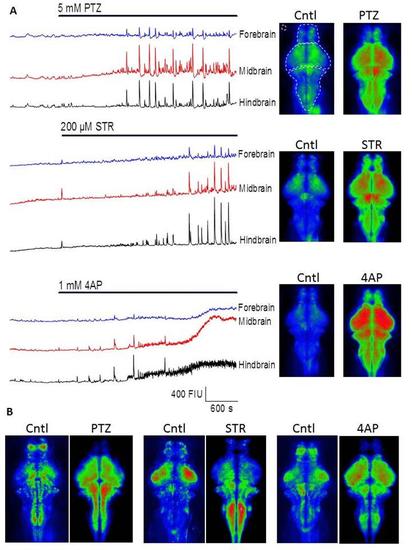
Wide-field imaging reveals CNS region-specific convulsant induced hyperactivity A) Left, time courses of GCaMP fluorescence intensity from time series collected with wide-field fluorescence imaging in three typical experiments. The bars indicate the time of drug application for PTZ, Strychnine and 4-AP and the portion of the trace to the left hand side of these bars indicates the pre-treatment (baseline) level of activity. The basal level of fluorescence was ~200 fluorescence intensity units in each area and the traces have been offset for clarity. Right, mean intensity projections across 300 consecutive frames (i.e. 5 min) collected either just prior to drug addition (left), or after 40-45 minutes drug treatment (right). The upper left image illustrates where the forebrain, midbrain and hindbrain regions of interest were located. The corresponding traces are coloured blue, red and black in each of the time course plots. B) Plots to indicate the degree of signal variance seen across the imaged x-y plane. These were compiled by creating projections of standard deviation across 300 frames and then (because SD is higher in the drug treated time-points) normalizing each pixel to the average standard deviation across the entire CNS. These normalized images were then pseudo-coloured and displayed between 1/3rd of mean SD (blue) and 3 times mean SD (red). Note how the drugs cause areas of greatest variation to change relative to their in subject controls and also how the different drugs seem to create different patterns.,/p> |