
- Title
-
Ca2+ release via two-pore channel type 2 (TPC2) is required for slow muscle cell myofibrillogenesis and myotomal patterning in intact zebrafish embryos.
- Authors
- Kelu, J.J., Webb, S.E., Parrington, J., Galione, A., Miller, A.L.
- Source
- Full text @ Dev. Biol.

CRISPR/Cas9-induced mutagenesis of tpcn2. (A) Design of the 23-bp tpcn2 target sequence. (Bi) Evaluation of the mutation efficiency (with/without AvaI digestion) in the F0 injected embryos as shown by 2% agarose gel electrophoresis. The incomplete digestion observed might be due to the presence of a mutation within the restriction site. M is the DNA marker. (Bii) The mutation efficiency in embryos injected with different concentrations of gRNA; this was calculated by dividing the band intensity of the undigested band by the intensity of the undigested and digested bands. (C,D) Sanger sequence analysis of (C) two representative mutant alleles found in the F0 founder embryos and of (D) two separate germline transmitted mutant alleles, which were identified in two F1 heterozygous fish after the F0 founder fish were outcrossed. Ref is the reference sequence. (Ei) Representative 3% agarose gel electrophoresis showing the genotype of the tpcn2dhkz1a mutant. In the heterozygote, there are two bands; this is due to the formation of a DNA heteroduplex, comprising the WT and mutant DNA, with the latter migrating more slowly. (Eii-Eiv) This was confirmed by subsequent Sanger sequence analysis of the corresponding DNA samples. The red arrowheads indicate the location of the 8-bp deletion. (Fi) The wild-type tpcn2 mRNA transcript (showing just exons 1, 9 and 10) and the design of the forward (F) and reverse (R3) primers used for RT-PCR. The target sequence of R3 spans the deletion locus in the tpcn2dhkz1a mutant transcript (see orange rectangle in exon 9). (Fii) The tpcn2dhkz1a mutant mRNA transcript (showing just exon 1, the mutated exon 9, and exon 10), and showing the location of the 8-bp deletion (see orange arrow in exon 9). (Fiii) Representative 2% agarose gel electrophoresis showing the absence of the RT-PCR product in the tpcn2dhkz1a homozygote using the F+R3 primer set. β-actin was used as the internal control. (Gi-Giii) Representative confocal single optical sections of SMCs in (Gi) wild-type and (Gii-Giii) tpcn2dhkz1a mutant embryos at 24 hpf, after they were immunolabeled with the anti-TPC2 antibody, to show the down-regulation and disappearance of TPC2 striations, respectively. The red dashed lines indicate the SMC boundaries, which were revealed by phalloidin-labeling (data not shown); whereas the red arrowheads indicate the TPC2 banding pattern of localization. (Hi-Hiii) Representative bright-field images of: (Hi) wild-type, and (Hii-Hiii) tpcn2dhkz1a mutant embryos at 72 hpf to show the reduction in pigmentation in the eye, head, and trunk of the mutant larvae (see black, blue, and green arrowheads, respectively). An accumulation of blood cells was also seen in the heart of the mutants (see red arrows). In panels (E-H), WT, Hetero, and Homo are wild-type, heterozygotes and homozygotes, respectively. Scale bars, 3 µm in panel (G); and 250 µm in panel (H). PHENOTYPE:
|

Effect of MO-based knockdown (without and with mRNA rescue) and CRISPR/Cas9-knockout of TPC2 on the organization of the trunk musculature and the formation of the sarcomeres. Embryos were (A) untreated or (B-G) injected with: (B) ~5 ng standard control-MO; (C) ~7.5 ng p53-MO; (D) ~2.5 ng TPCN2-MO-T with p53-MO; (E) ~5 ng TPCN2-MO-S with p53-MO; (F) ~1.3 ng TPCN2-MO-T+~2.5 ng TPCN2-MO-S with p53-MO; or (G) ~2.5 ng TPCN2-MO-T with p53-MO and ~50 pg tpcn2 mRNA. In addition, representative (H) heterozygous and (I) homozygous tpcn2 mutants are shown. All embryos were fixed at ~25 hpf and dual-labeled with phalloidin and the F59 antibody, to visualize F-actin (in red) and myosin heavy chain (in green) in the trunk musculature, respectively. Panels show a series of optical sections projected as single images at (Ai-Ii) low and (Aii-Iii) higher magnification when the red and green channels are merged; overlapping regions are shown in yellow. The higher magnification images of the SMC myofibers, reveal the presence or absence of the sarcomeric banding pattern of the F-actin and myosin heavy chain. The white arrows in panels Di-Fi, Hi-Ii show examples of elongated (flexuous) SMC myofibers; ‘A’, ‘I’, ‘M’ and ‘Z’ in panel Aii indicate the A-band, I-band, M-line and Z-line of a sarcomere respectively; and the white arrowheads in panels Gii-Iii indicate the appearance of some banding but clear sarcomeres are not obvious. Ant. and Pos. in panel Ai are anterior and posterior, respectively. Scale bars, 50 µm in panels Ai-Ii; and 2 µm, in panels Aii-Iii. |
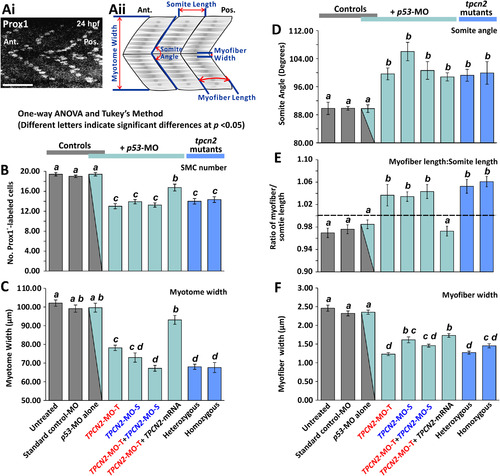
Quantification of the effect of MO-based knockdown (without/with mRNA rescue) and CRISPR/Cas9-knockout of TPC2 on the organization of the trunk musculature and the formation of the sarcomeres. (Ai) The number of SMCs in each somite was determined via immunolabelling embryos fixed at ~24 hpf with an anti-prox1 antibody (a representative example of an untreated control is shown). Scale bar, 50 µm. (Aii) Schematic to show the various dimensions of the trunk musculature and SMC myofibers that were measured using series of optical sections projected as single images from the fluorescently-labeled embryos at ~25 hpf (for representative examples, see Fig. 3), in order to determine the level of disruption on SMC development following TPC2 knockdown or knockout. (B-F) Bar charts to show the mean ±SEM: (B) number of SMCs; (C) myotome width, and (D) somite angle, (all n≥12, from 3 somites in ≥4 embryos); (E) myofiber length: somite length ratio (these lengths were measured in n≥72 myofibers and n≥24 somites, respectively ≥4 embryos); and (F) myofiber width (n≥40, from 3 somites in ≥4 embryos). The dashed black line in panel (E) indicates a myofiber: somite length ratio of 1. Statistical analysis was carried out using one-way ANOVA and significance differences (at p<0.05) as shown by the different letters, a-d between any pair of groups was determined using the Tukey's post hoc method. Thus, significant differences between groups were denoted by different letters whereas groups where no significant differences were observed displayed the same letter. PHENOTYPE:
|
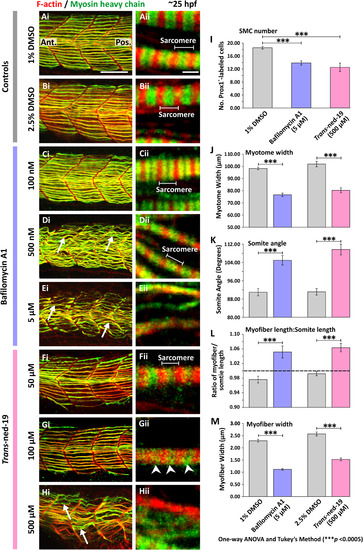
Effect of bafilomycin A1 and trans-ned-19 on the organization of the trunk musculature and the formation of the sarcomeres. At 17 hpf, embryos had the terminal portion of the tail excised and then were treated with either: (A) 1% DMSO or (B) 2.5% DMSO in Danieau's solution (controls of the bafilomycin A1 and trans-ned-19 treatment, respectively), or (C-E) bafilomycin A1 at: (C) 100 nM, (D) 500 nM, or (E) 5 µM; or (F-H) trans-ned-19 at (F) 50 µM, (G) 100 µM or (H) 500 µM. All the embryos were fixed at ~25 hpf and dual-labeled with phalloidin and the F59 antibody, to visualize F-actin (in red) and myosin heavy chain (in green) in the trunk musculature, respectively. The panels show a series of optical sections projected as single images at (Ai-Hi) low and (Aii-Hii) higher magnification when the red and green channels are merged; overlapping regions are shown in yellow. The higher magnification images of the SMC myofibers reveal the presence or absence of the sarcomeric banding pattern of the F-actin and myosin heavy chain. The white arrows in panels Di, Ei and Hi show examples of elongated SMC myofibers; and the white arrowheads in panel Gii indicate the appearance of some banding but clear sarcomeres are not obvious. Ant. and Pos. in panel Ai are anterior and posterior, respectively. Scale bars, 50 µm in panels Ai-Hi; and 2 µm, in panels Aii-Hii. (I-M) Quantification of the effect of bafilomycin A1 and trans-ned-19 on the organization of the trunk musculature and the formation of the sarcomeres. These bar charts show the mean ±SEM: (I) number of SMCs; (J) myotome width, and (K) somite angle, (all n=12 from 4 embryos); as well as the (L) myofiber length: somite length ratio (these lengths were measured in n=72 myofibers from 4 embryos); and (M) myofiber width (n=40, from 4 embryos). The dashed black line in panel (L) indicates a myofiber: somite length ratio of 1. The asterisks indicate statistically differences at p<0.0005 (***) |
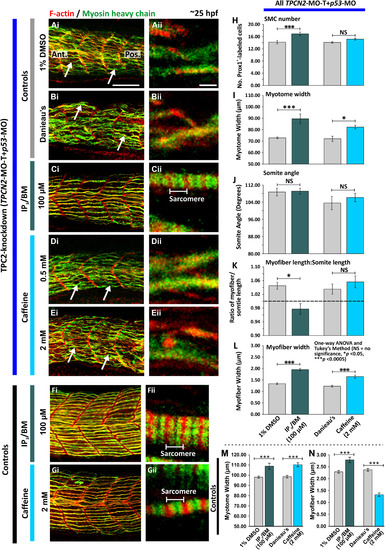
Effect of IP3/BM and caffeine on the organization of the trunk musculature and the formation of the sarcomeres after TPC2-knockdown. Embryos were (A-E) injected with TPCN2-MO-T and p53-MO at the 1-cell stage or (F,G) allowed to develop without MO injection. At 17 hpf, the terminal portion of the tail was excised after which embryos were treated with either: (A) 1% DMSO in Danieau's solution (control of the IP3/BM treatment); (B) Danieau's solution alone (control of the caffeine treatment), (C,F) IP3/BM at 100 µM; or (D,E,G) caffeine at (D) 0.5 mM or (E,G) 2 mM. Embryos were then fixed at ~25 hpf, and dual-labeled with phalloidin and the F59 antibody, to visualize F-actin (in red) and myosin heavy chain (in green) in the trunk musculature, respectively. The panels represent a series of optical sections projected as single images at (Ai-Gi) low and (Aii-Gii) higher magnification when the red and green channels are merged; overlapping regions are shown in yellow. The higher magnification images of the SMC myofibers reveal the presence or absence of the sarcomeric banding pattern of the F-actin and myosin heavy chain. The white arrows in panels Ai, Bi, Di and Ei, show examples of elongated SMC myofibers. Ant. and Pos. in panel Ai are anterior and posterior, respectively. Scale bars, 50 µm in panels Ai-Gi; and 2 µm, in panels Aii-Gii. (H-L) Quantification of the effect of IP3/BM and caffeine after TPC2-knockdown on the organization of the trunk musculature and the formation of the sarcomeres. These bar charts show the mean ±SEM: (H) number of SMCs; (I) myotome width, and (J) somite angle, (all n=12 from 4 embryos); as well as the (K) myofiber length: somite length ratio (these lengths were measured in n=72 myofibers from 4 embryos); and (L) myofiber width (n=40, from 4 embryos). The dashed black line in panel (K) indicates a myofiber: somite length ratio of 1. (M,N) Quantification of the effect of IP3/BM and caffeine in control embryos (without TPC2 knockdown) on (M) the myotome width (n≥9, from ≥3 embryos), and (N) myofiber width (n≥30, from ≥3 embryos). The asterisks indicate statistically differences at p<0.05 (*) and p<0.0005 (***). |

ZFIN is incorporating published figure images and captions as part of an ongoing project. Figures from some publications have not yet been curated, or are not available for display because of copyright restrictions. PHENOTYPE:
|

Visualization and quantification of the amount of apoptosis after MO-based knockdown (without and with mRNA rescue), CRISPR/Cas9-knockout of TPC2, or following pharmacological treatment with bafilomycin A1 or trans-ned-19. Embryos were (A-C) untreated or (D-I) injected with: (D) ~5 ng standard control-MO; (E) ~7.5 ng p53-MO; (F) ~2.5 ng TPCN2-MO-T with p53-MO; (G) ~5 ng TPCN2-MO-S with p53-MO; (H) ~1.3 ng TPCN2-MO-T+~2.5 ng TPCN2-MO-S with p53-MO; or (I) ~2.5 ng TPCN2-MO-T with p53-MO and ~50 pg tpcn2 mRNA. (J,K) Representative (J) heterozygous and (K) homozygous tpcn2 mutants are also shown. In addition, wild-type embryos were treated with: (L) 1% DMSO; (M) bafilomycin A1 at 5 µM; or (N) trans-ned-19 at 500 µM. (A-N) All the embryos were then fixed at ~24 hpf, and cells undergoing apoptosis were labeled using the TUNEL assay. These are bright-field images onto which are superimposed the respective fluorescence images showing TUNEL-positive cells in red. The yellow rectangles show the size and location of the regions of interest (ROIs) used for quantification. (A,B) Representative TUNEL (A) positive and (B) negative controls. In panels (L-N), the black arrowheads indicate the elevated levels of apoptosis in the region of the trunk damaged during tail excision. (O) Bar chart to show the mean ±SEM fluorescence intensity within the ROIs (n=3). Statistical analysis was carried out using one-way ANOVA. The asterisk indicates the significance difference (at p<0.001) between the TUNEL positive control and the other groups, as determined using the Tukey's post hoc method. No other significant differences were found among the groups. Scale bar, 25 µm. |
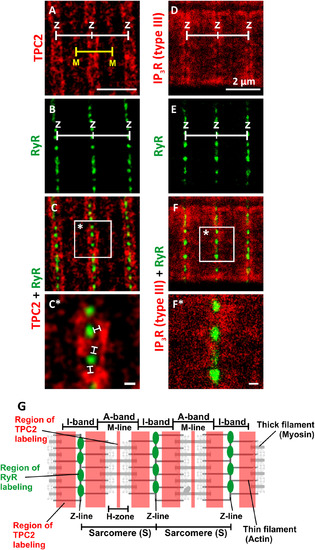
Visualization of TPC2, IP3R (type III) and ryanodine receptors (RyR) by dual-immunolabeling and dual-colour stimulated emission depletion (STED) super resolution imaging. Representative examples of muscle cells that were dissociated from the trunk of zebrafish embryos at 48 hpf, plated onto a coverslip for 1 h and then fixed and dual-immunolabeled with either (A-C,C*) the 2137A anti-TPC2 and 34C anti-ryanodine receptor primary antibodies or (D-F,F*) the IP3R (type III) and 34C antibodies. STED images of: (A) TPC2, (B) RyR, and (C) the TPC2 and RyR images when merged, as well as (D) IP3R (type III), (E) RyR and (F) IP3R and RyR images when merged. The regions bounded by the white squares in panels C and F are shown at higher magnification in panels C* and F*. The white lines in panel C* indicate the presence of distinct gaps between the RyR and TPC2 clusters when observed via STED super-resolution imaging. Z and M indicate the Z- and M-lines of the sarcomere, respectively. Scale bars, 2 µm (A-F); and 200 nm (C*,F*). (G) Schematic illustration of two sarcomeres and the relative localization of TPC2 and RyR in the adjacent lysosomes and SR, respectively (see Fig. 10 for a 3D representation of an SMC). EXPRESSION / LABELING:
|
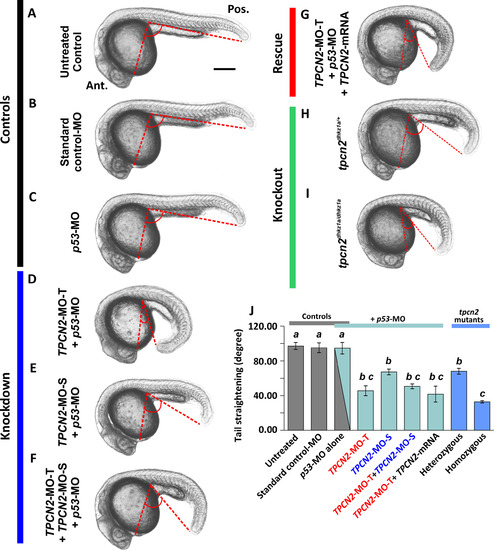
Effect of MO-based knockdown (without and with mRNA rescue) and CRISPR/Cas9-knockout of TPC2 on the gross morphology of embryos at ~25 hpf. Embryos were (A) untreated or (B-F) injected with: (B) ~5 ng standard control-MO; (C) ~7.5 ng p53-MO; (D) ~2.5 ng TPCN2-MO-T with p53-MO; (E) ~5 ng TPCN2-MO-S with p53-MO; (F) ~1.3 ng TPCN2-MO-T+~2.5 ng TPCN2-MO-S with p53-MO; or (G) ~2.5 ng TPCN2-MO-T with p53-MO and ~50 pg tpcn2 mRNA. In addition, representative (H) heterozygous and (I) homozygous tpcn2 mutants are shown. Bright-field images were collected of all the embryos at ~25 hpf and the tail straightening angle was measured. Ant. and Pos. in panel A are anterior and posterior, respectively. (J) Quantification of the tail straightening angle. This bar chart shows the mean ±SEM tail straightening angle from n≥3 embryos in each group. Statistical analysis was carried out using one-way ANOVA and significance differences (at p<0.05) as shown by the different letters, a to c, was determined using the Tukey’s post hoc method. Thus, significant differences between groups were denoted by a different letter, whereas groups where no significant differences were observed had the same letter. |
Reprinted from Developmental Biology, 425(2), Kelu, J.J., Webb, S.E., Parrington, J., Galione, A., Miller, A.L., Ca2+ release via two-pore channel type 2 (TPC2) is required for slow muscle cell myofibrillogenesis and myotomal patterning in intact zebrafish embryos., 109-129, Copyright (2017) with permission from Elsevier. Full text @ Dev. Biol.