
- Title
-
Smad6 determines BMP-regulated invasive behaviour of breast cancer cells in a zebrafish xenograft model
- Authors
- de Boeck, M., Cui, C., Mulder, A.A., Jost, C.R., Ikeno, S., Ten Dijke, P.
- Source
- Full text @ Sci. Rep.
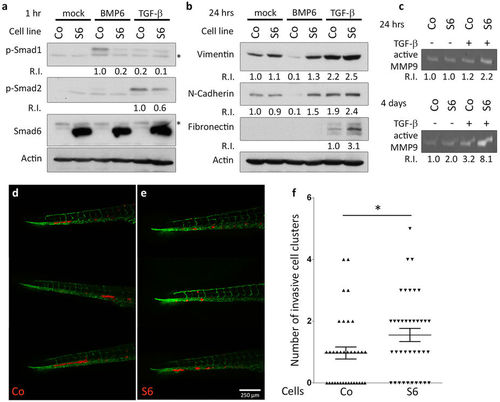
Overexpression of Smad6 in MCF10A M2 blocks BMP signalling and potentiates invasion. (a,b) Western blot analysis of total protein from control (CO) and Flag-Smad6 stable expression (S6) MCF10A M2 cell lines treated with 50 ng/ml BMP6 or 0.5 ng/ml TGF-β for 1 hr (a, *aspecific bands) and 50 ng/ml BMP6 or 5 ng/ml TGF-β for 24 hrs (b). (c) Gelatin zymogram showing MMP9 activity in conditioned medium of mock and TGF-β treated MCF10A M2 cells. (d,e) Representative images of 6 dpi zebrafish larvae showing the invasion of control (CO) (d) and Smad6 overexpression (S6) (e) MCF10A M2 cells. (f) Quantification of invasive cluster numbers in CO and S6 MCF10A M2 injected zebrafish larvae. R.I.: Quantification of relative intensity. * 0.01 < p < 0.05. Scale bar: 250 μm. EXPRESSION / LABELING:
|
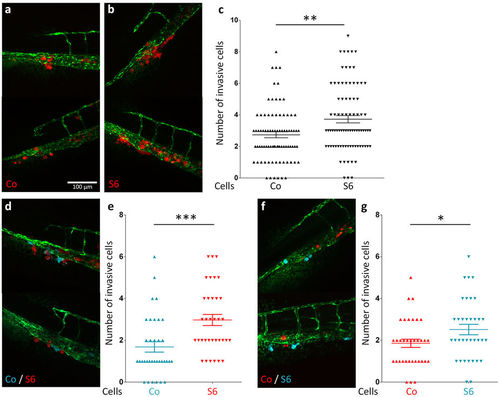
Stimulation of MDA-MB-231 cell invasion by Smad6. (a,b) Representative images of 6 dpi zebrafish larvae showing the invasion of CO (a) and S6 (b) MDA-MB-231 cells. (c) Quantification of invasive cell numbers in CO and S6 MDA-MB-231 injected zebrafish larvae. (d,f) Representative images of 6 dpi zebrafish larvae injected with pre-mixed mTurquoise-CO/mCherry-S6 cells or mTurquoise-S6/mCherry-CO cells. (e,g) Quantification of colour labelled CO and S6 invasive cell numbers in individual zebrafish larvae. Scale bar: 100 μm. *0.01 < P < 0.05; **0.001 < P < 0.01; ***P < 0.001. EXPRESSION / LABELING:
|
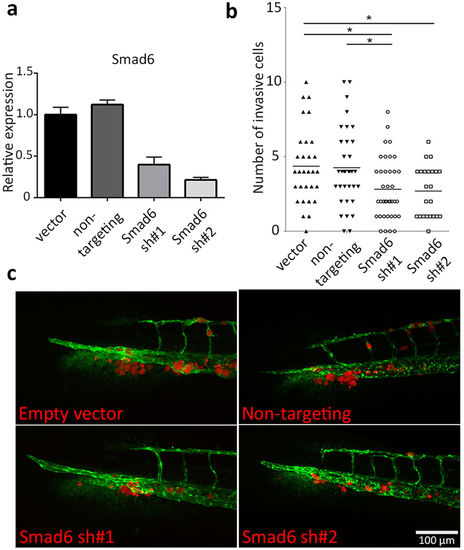
Smad6 knockdown results in reduced cell invasion of MDA-MB-231 cells. (a) Quantitative PCR (qPCR) analysis of Smad6 mRNA expression in MDA-MB-231 cells infected with control vector, non-targeting shRNA and two Smad6 shRNA constructs, respectively. (b) Quantification of invasive cell numbers in vector control, non-targeting control and Smad6 knockdown MDA-MB-231 cells injected zebrafish larvae. (c) Representative images of 6 dpi zebrafish larvae showing the Smad6 knockdown effect in MDA-MB-231 cell invasion. Scale bar: μm. 100 *0.01 < P < 0.05. EXPRESSION / LABELING:
|
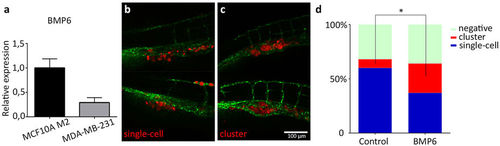
BMP6-induced cluster phenotype in MDA-MB-231 cell invasion. (a) qPCR analysis showing the BMP6 mRNA expression in MCF10A M2 and MDA-MB-231 cells. (b,c) Representative images of typical ‘single-cell’ invasion (b) and ‘cluster’ invasion (c) phenotype after BMP6 pre-treatment. (d) representation of the percentage of negative, cluster and single cell invasion phenotypes in zebrafish larvae injected with control and BMP6 pre-treated MDA-MB-231 cells. Scale bar: 100 μm. *0.01 < P < 0.05. EXPRESSION / LABELING:
|