
Image
|
Figure Caption
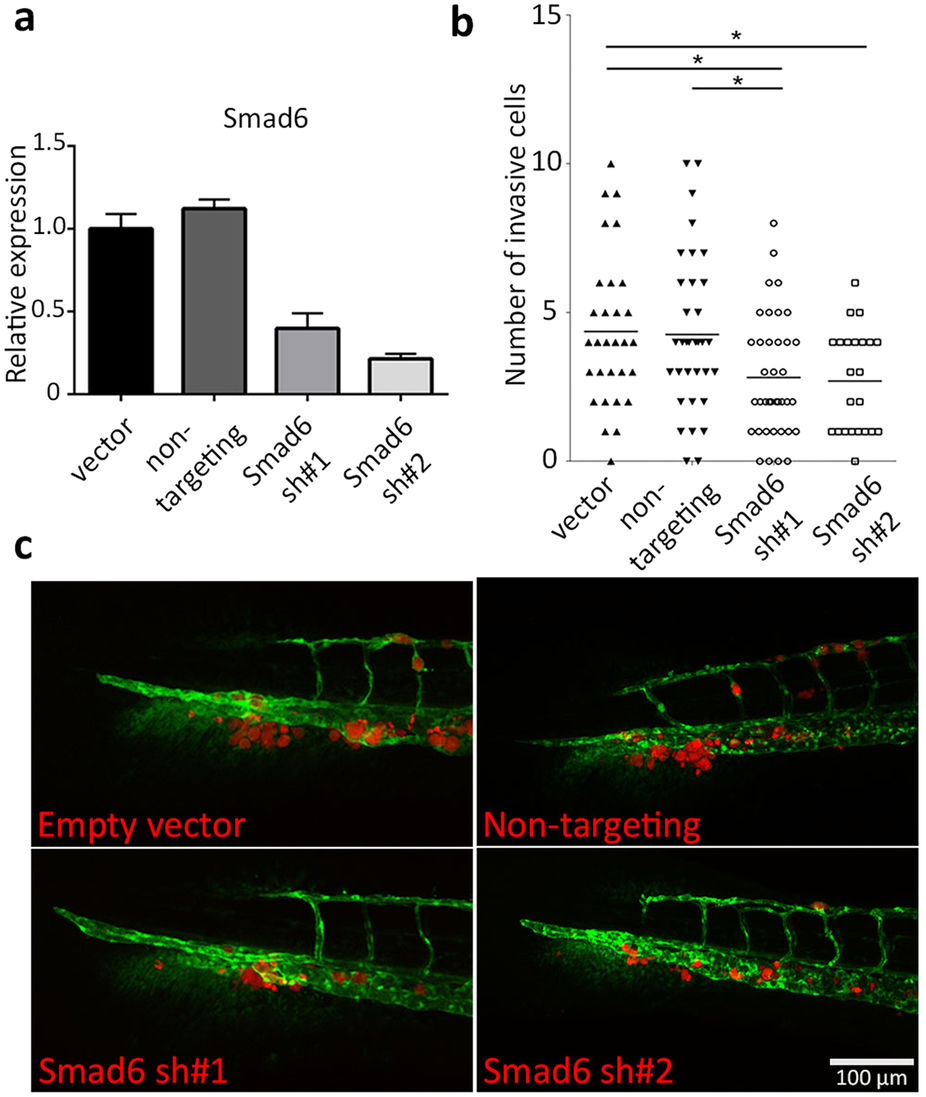
Fig. 4
Smad6 knockdown results in reduced cell invasion of MDA-MB-231 cells.
(a) Quantitative PCR (qPCR) analysis of Smad6 mRNA expression in MDA-MB-231 cells infected with control vector, non-targeting shRNA and two Smad6 shRNA constructs, respectively. (b) Quantification of invasive cell numbers in vector control, non-targeting control and Smad6 knockdown MDA-MB-231 cells injected zebrafish larvae. (c) Representative images of 6 dpi zebrafish larvae showing the Smad6 knockdown effect in MDA-MB-231 cell invasion. Scale bar: μm. 100 *0.01 < P < 0.05.
Figure Data
Acknowledgments
This image is the copyrighted work of the attributed author or publisher, and
ZFIN has permission only to display this image to its users.
Additional permissions should be obtained from the applicable author or publisher of the image.
Full text @ Sci. Rep.