
Image
|
Figure Caption
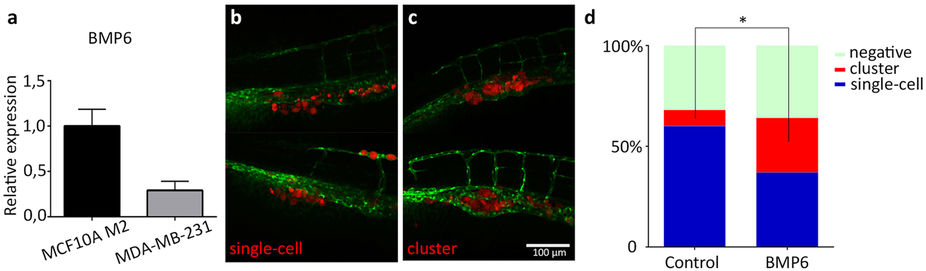
Fig. 5
BMP6-induced cluster phenotype in MDA-MB-231 cell invasion.
(a) qPCR analysis showing the BMP6 mRNA expression in MCF10A M2 and MDA-MB-231 cells. (b,c) Representative images of typical ‘single-cell’ invasion (b) and ‘cluster’ invasion (c) phenotype after BMP6 pre-treatment. (d) representation of the percentage of negative, cluster and single cell invasion phenotypes in zebrafish larvae injected with control and BMP6 pre-treated MDA-MB-231 cells. Scale bar: 100 μm. *0.01 < P < 0.05.
Figure Data
Acknowledgments
This image is the copyrighted work of the attributed author or publisher, and
ZFIN has permission only to display this image to its users.
Additional permissions should be obtained from the applicable author or publisher of the image.
Full text @ Sci. Rep.